The US dollar gapped higher on Monday and has spent the last several days going back and forth, basically in lockstep with the S&P 500. As we close out the week though, it looks as if the buyers are starting to take over again. If that’s going to be the case, this could be the beginning of something rather special in this pair.
Stock markets
Keep in mind that the stock markets have been all over the place as well, but it does look like they are trying to form some type of basing pattern. That generally is pretty good for this pair, as the market tends to follow right along with risk appetite. With that in mind it makes sense that the S&P 500 should be washed at the same time.
If we can break above the top of the candle stick for the previous week, it’s very likely that the US dollar will follow right along with a melt up in the stock market that could send the S&P 500 towards the 2900 level, possibly even 2950. If you see that move, this pair should be one of the main beneficiaries.
Major support below
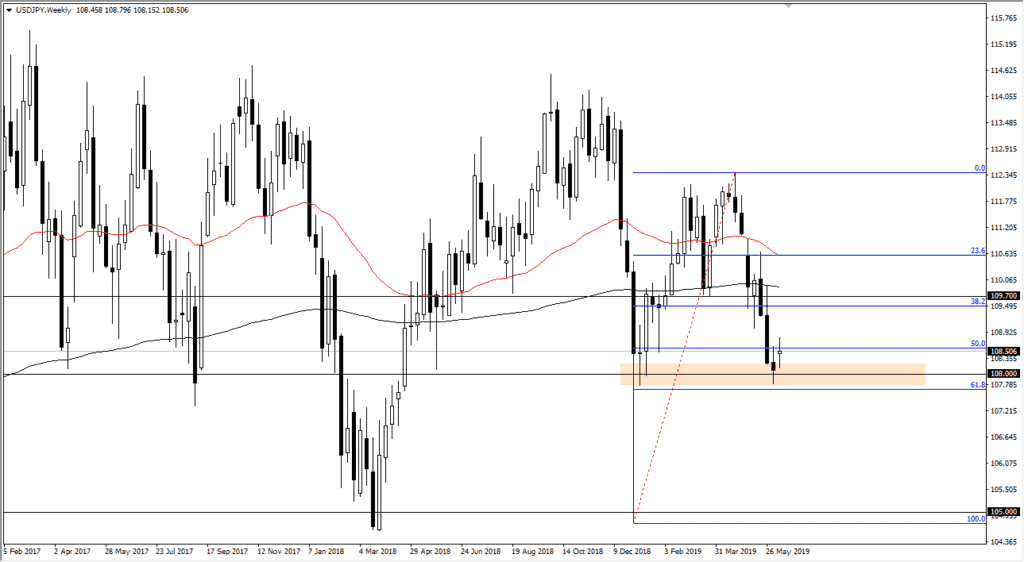
USD/JPY weekly
There is major support below, in the form of the 61.8% Fibonacci retracement level, and that general vicinity that I have marked by the rectangle. The fact that we gapped higher, came back to fill the gap, and then rally again shows that there is a lot of support for this market going higher. Keep in mind that the Japanese yen is one of the few currencies out there that is considered to be “safer” than the US dollar, so that’s why risk appetite is so important here.
If we were to break down below that support though, basically the ¥107.70 level, that would probably signify some type of breakdown in risk appetite globally and open up the door for a move down to the ¥105 level underneath.
To the upside
To the upside, I think that this market could go as high as ¥109.70 on a breakout, and if we clear that area the pair will go much higher. While I do think that both this market and the S&P 500 have a lot of strength underneath them, I also think that it’s going to be hard to break out for an extreme distance and we will probably need to take a lot of momentum into that move.
The main takeaway
The main take away here is that there is certainly a lot of support underneath and it makes sense that we go higher. While we are focusing on the weekly chart, we use those as guides and enter based upon daily charts. The pullback should offer plenty of value, but if we do break down below that significant 61.8% Fibonacci retracement level, then we know to get aggressively short as we would not only see this market break down, but we would probably see stock markets do the same. A little bit of patience could go a long way.


