Aussie Dollar Looking to 0.69

- Australian dollar reaching towards recent resistance
- Heavily influenced by US-China
- Major downtrend
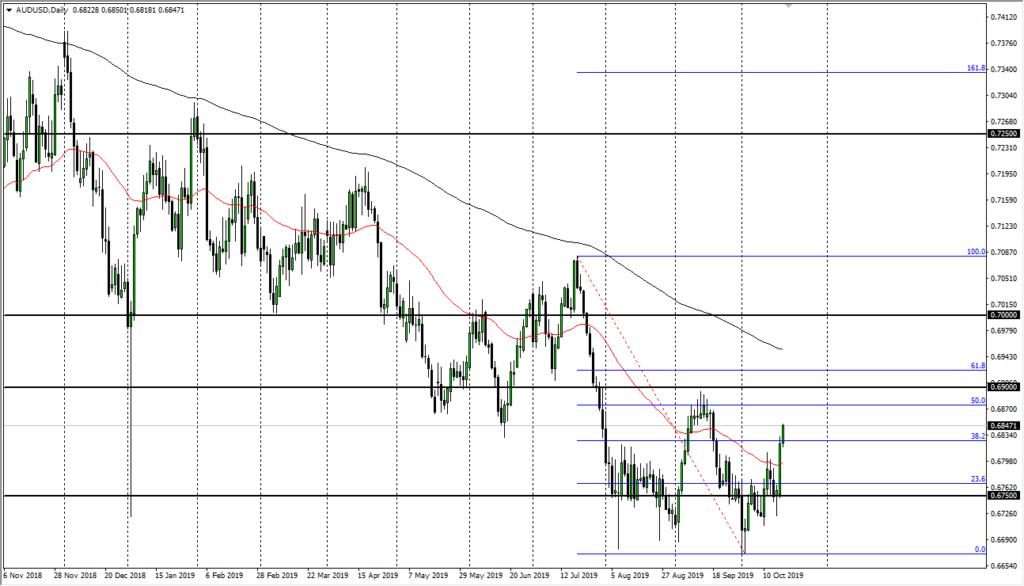
The United States has rallied a bit during the trading session on Friday as we continue to grind higher and towards the 0.69 level. That’s an area that should cause a bit of resistance, as it has recently been the top of the recent move higher. Ultimately, the United States dollar will continue to be thought of as the safety end of this currency pair, just as the Australian dollar will be more of a “risk-on” asset.
Longer-term downtrend

AUD/USD chart
The most important thing to pay attention to on the chart is that the long-term trend is most certainly negative. Overall, this is a market that continues to look very bearish based on not only the technical analysis, but the overall trend studies that can be shown by moving averages. Yes, the market has recently broken above the 50-day EMA, but ultimately this is a market that will still need to break above the 200-day EMA before people start to question the overall negativity.
The negativity has a lot to do with global economic slowdown, as seen through PMI figures, as well as GDP. As Australia is a major supporter of hard commodities such as copper, aluminum, and iron, it makes sense that it will move back and forth with global growth. Beyond that, it is highly levered to the Chinese economy, which has been showing a slowdown as of late.
The game plan going forward
Looking at the chart, the most recent resistance barrier that proves itself worthwhile is the 0.69 level. It is also the 50% Fibonacci retracement level from the recent move lower. There should be a bit of market memory in that area, and therefore it’s very unlikely that the market will simply just slice through it. However, if the market were to break through there, the next barrier is just above the 61.8% Fibonacci retracement level, which would be the 200-day EMA.
This bounce makes sense as the market had been at extreme lows, but a sudden trend change and shot straight up in the air don’t make any sense in the current environment. Simply looking for signs of exhaustion and fading makes the most sense until something substantially changes between the Americans and the Chinese, especially considering that we are seeing recessionary headwinds and places like Europe further driving down demand for commodities.

