Bitcoin to Make Decision Soon

- Bitcoin sitting at a vital level
- Flat for the session
- Recent volatility disappears
Bitcoin has done almost nothing for the last several days but is sitting at a significant level currently. Because of this, the market is very likely to make a significant movement from this area, but it will need some type of catalyst. Ultimately, the market sitting here does suggest that traders will continue to look for that catalyst, as there has been no reason to move in one direction or the other.
That wasn’t the case over the past weekend though, as the Chinese suggested they were going to invest heavily in blockchain. That had traders buying the first thing they typically buy in these scenarios: Bitcoin.
Technical analysis

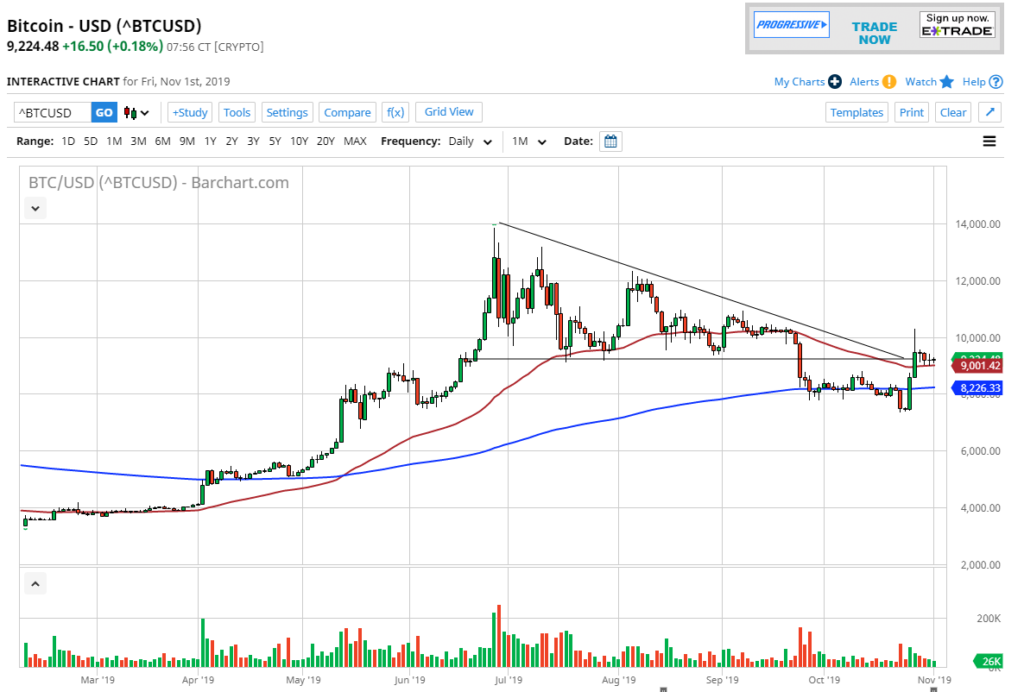
BTC/USD chart
The technical analysis for this pair is relatively straightforward: the market had broken below the bottom of a descending triangle recently and sliced through the 200-day EMA. During that weekend statement, the market shot through the roof and broke above the $10,000 level momentarily.
However, the market has broken back down below there, which is a negative sign. The fact that it could not break out above the recent breakdown candles suggests there is still more of a negative slant to this currency.
The market is sitting on the 50-day EMA, which attracts a certain amount of attention, and it is sitting at the $9000 level, which is a large, round, psychologically significant figure.
One thing that should be paid attention to is volume, which has dropped significantly during the week, showing that the true interest in Bitcoin has not picked up. The fact that the surge was so strong but has not continued speaks volumes about whether or not there is sustainability in this move.
It is also worth paying attention to the fact that the market is sitting at the bottom of the descending triangle that broke down recently and has not been able to break back above it. According to the descending triangle, the breakdown in this market should have sent this market down to the $4800 level.
The trade going forward
The trade going forward is relatively straightforward. If the market can break back down below the 50-day EMA, it’s likely to continue to go lower, reaching towards the 200-day EMA at the $8225 level, followed by the $8000 level. Eventually, it could go down to the target based on the descending triangle.
Ultimately, if the market was to break above the highs during the spike that broke the $10,000 level, then that would be a very bullish sign and should be bought. However, until we get some type of clarity in the marketplace, simply waiting for the next impulsive move is what most traders will be doing.

