Crude Oil Starts Week on Positive Note

- Move started on Thursday with hammer
- Trend line continues to offer support
- Zone of support just below
- Oversold conditions
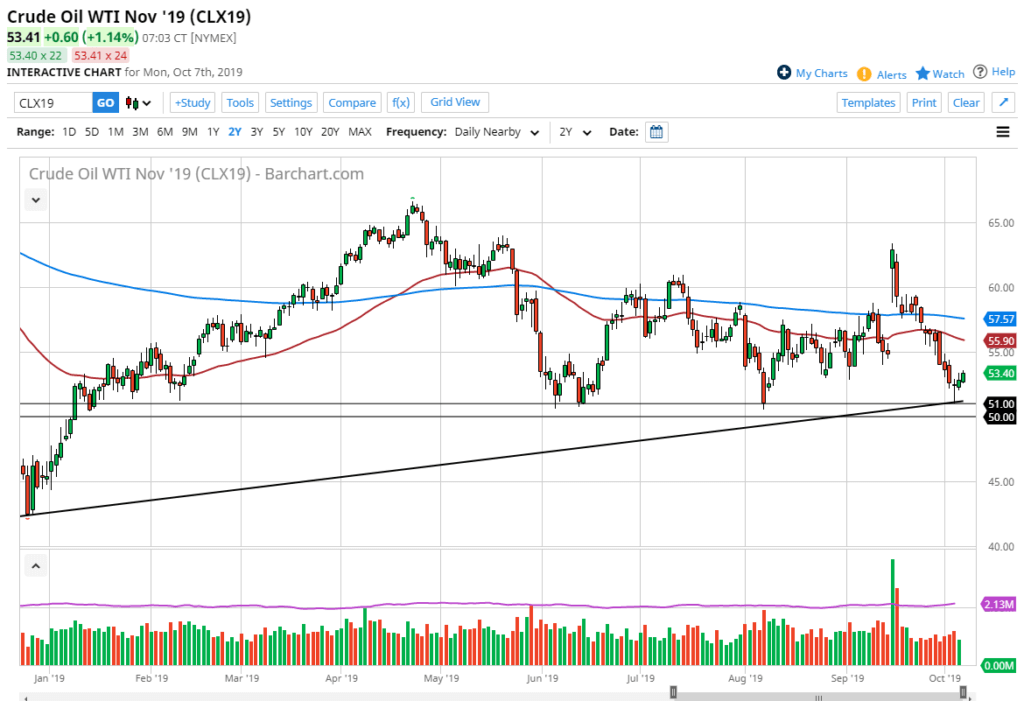
The West Texas Intermediate Crude Oil market rallied during the trading session on Monday. It broke above the top of the hammer from the trading session last Thursday, which started the move to begin with. The market has been a bit oversold, and as a result it makes sense that we can see a recovery going forward. However, it would be rather optimistic to think that the market is going to turn around and start trending higher for the long term.
Technical bounce

Oil chart
Looking at the chart, it’s easy to see that the market has been quite oversold. Beyond that, there is a “zone of support” that starts at the $51 level and extends down to the $50 level. It has historically been defendant, so it’s no surprise that much of the same action has happened over the last couple of days.
At this point, a technical bounce would be expected. The hammer is a very bullish sign, and now that the market has broken above it, there are trapped short-sellers looking to cover their positions. The technical bounce is a playable setup, but that doesn’t necessarily mean that crude oil is going back to the highs. What it does mean is that the momentum was far too overextended to slice through major support.
Demand picture still sloppy
The demand for crude oil has been rather sloppy lately: global markets have softened, along with global economies. In a slowing global economy, crude oil demand will slacken as it is the lifeblood of transportation and industry. However, the world isn’t in a massive depression, so there is always going to be a certain “hard floor” when it comes to total crude oil used.
Ultimately, this market is due for a bounce towards the 50-day EMA above, which is clearly dipping below the $56 level. This bounce is a tradable event, but it should be approached with a certain amount of caution. The alternate scenario would be a break down below the $50 level, which would drive this market much lower, possibly opening up a move to the support level at the $45 mark. At that point, the market would be testing a major consolidation area which could also offer a massive amount of support and volatility.
To the upside, clearing the 50-day EMA opens up the possibility of reaching towards the 200-day EMA, although this seems to be highly unlikely.

