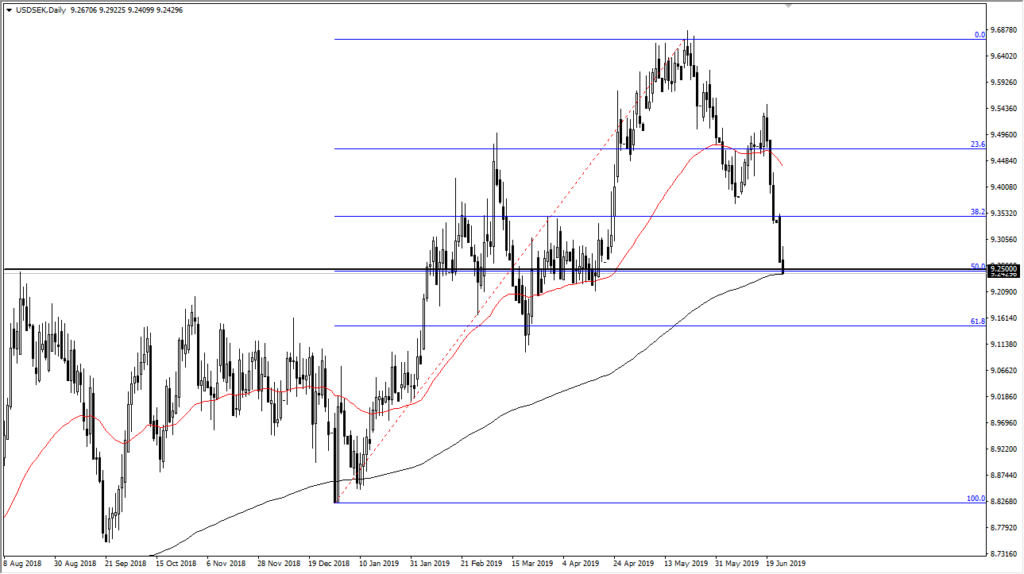
US dollar testing 200 EMA against Krona

The US dollar initially tried to rally during trading on Tuesday but then rolled over to show signs of exhaustion again. At this point, the US dollar is trading at the 9.25 SEK level, an area that has been important more than once, and of course has the added bonus of being attached to a couple of technical indicators as well.
Federal Reserve
By now, you know that the Federal Reserve has switched to a dovish tone, and that of course works against the value of the greenback. We have fallen rather hard, so the question now is whether or not we continue to go lower, or if we find a short-term bounce. That being said, the next 24 hour should be rather crucial as we have moved beyond the central bank expectations and onto the technical analysis.
Confluence of technical indicators

USD/SEK chart
There is a confluence of technical indicators on this chart, not the least of which will be the fact that the 9.25 SEK level is a previous support and resistance, but we also have the 50% Fibonacci retracement level right on top of that from the most recent rally from a longer-term standpoint. Beyond that as well, we have the 200 day EMA sitting just below the bottom of the candle stick. Because of this, the next daily candle stick could tell the story. If we break down and close below the 200 day EMA, it’s likely that we will try to grind out to the 61.8% Fibonacci retracement level. However, a break above the top of the candle stick would signify that we are ready to bounce and go higher.
The main take away
The main take away from this of course is that the US dollar has been pummeled rather hard lately, and we could get a short-term bounce from here. However, keep in mind that this market is highly risk dependent, so if we get some type of major “risk off” attitude around the world, the US dollar will turn right back around and rally. The next 24 hour should give us a clear signal as to whether we attempt to get the 9.15 SEK, or 9.35 SEK.
This is the type of pair that tends to trend for a long time, so being a bit patient is probably the best way to go. This is why I will be waiting for a daily close to place my next trade. One thing that should be pointed out is that a break above the top of the candle stick to the upside would be bullish not only because it’s a turnaround from the 50% Fibonacci retracement level, but the significant selloff we have had after the open suggests that there is a lot of selling pressure there again. That being the case, if we can break above there, it would show a major breach of significant selling. To the downside, the 61.8% Fibonacci retracement level would make quite a bit of sense, as the 9.15 SEK level has seen the lot of action lately.

