One of the most common running patterns, if not the most common one, is the double three running. Such a pattern appears most of the time as the second wave in an impulsive move, and the third wave to follow in such a case is always the extended one. Not only should the price to follow be a minimum of 161.8% when compared with the length of the first wave, but it should also have few or no retracements. It means that it is very likely that for the third wave, the whole five-wave structure of a lower degree will this time have a running correction as well. The name of this correction tells us much about what to expect, in the sense that the word “double” is telling us a complex correction is about to form. This complex correction, because of its running nature, should have a large x-wave, so look for it to stretch beyond 61.8% when compared with the previous corrective wave. Most of the time the x-wave will actually retrace the whole previous correction and some more, and will be either a double or a triple zigzag, or a combination of some sort. In any case, the x-wave will trick many people into thinking the third wave has already started, which is a crucial mistake.
Trading a Double Three Running Pattern
There are two things to keep in mind when trading a double three running pattern, both of them equally important: the x-wave, and the triangle that ends the pattern. The x-wave gives us the early sign that such a pattern might form, while the triangle, in the end, offers the add-on to a trade that should already be in place. A double three running pattern is very similar to a double combination, a concept that will be covered here on Forex Trading Academy a bit later. The only difference between the two is, as mentioned at the start of this article, the length of the x-wave. In the case of a double combination, we’re talking about an x-wave that is a short one, while a double three running pattern has a large x-wave. Other than that, all things are the same: two corrections connected by an x-wave.
Enter when the 61.8% Retracement is Exceeded
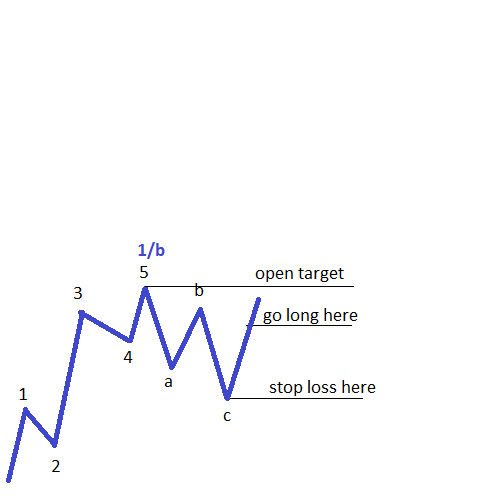
The way to trade the double three running pattern depends very much on the move prior to it. That move must be a five-wave structure, and therefore it can only be the first wave of an impulsive move of a larger degree, or the a-wave of a zigzag of a larger degree. It doesn’t really matter though what the previous count is, as long as it is an impulsive wave. Therefore, the first thing to watch before deciding whether a correction is a double three running is to make sure the move prior to it is an impulsive wave. If the answer is affirmative, then that impulsive wave must be corrected. This is the role of the first correction, or the first part of the overall double three running pattern. Keep in mind that at this moment in time we have no idea whether the market is forming a running correction or not – all we know is the fact that a five-wave structure has been followed by a correction. The next thing to do is to see whether the move that follows the correction is retracing more than 61.8% out of it. If so, it is an early sign of a possible running correction of larger degree, and a first trade should be taken by the time the retracement goes more than 80%. The take profit for the trade should be left open, as we need to first find out the exact end of the double three running pattern before calculating the possible extension. As for the stop loss, this one must be at the end of the first corrective phase of the double three running.
Add a New Trade When the b-d Trendline is Broken
The focus shifts now to the second corrective phase of the double three running pattern, and this one is almost always a triangle. The x-wave should be an aggressive correction, it should stretch beyond the end of the previous impulsive wave, and it should be quite a fast move relative to the previous one. A triangle is defined by the a–c and b–d trendlines that are drawn from the end of those respective waves, and the key stays with the moment the b–d trend line is broken. When this happens it means the triangle is completed. However, according to the logical process described here, when the triangle is broken it means that the overall double three running is completed as well. This gives us the end of either the second wave in the impulsive wave of a larger degree, or the b-wave I in the zigzag of a larger degree. A second trade should be taken by the time the b–d trendline is broken and, if the b–d trendline is visible before the triangle breaks, a pending order can be used, just to be sure the trade is not missed.
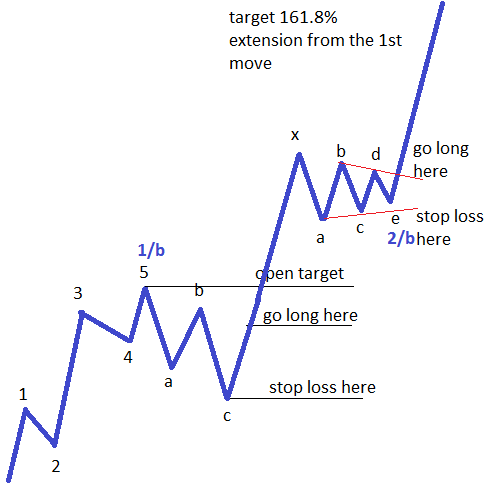
The take profit should be derived from the length of the first impulsive wave, or the five-wave structure that was there prior to the double three running. By measuring that five-wave structure with a Fibonacci tool and finding out the 161.8% point, we have an educated guess about the minimum distance the price will travel for the third or c-wave to follow the double three running. This distance should be projected from the end of the triangle that completed the double three running, and the end of it should be the take profit for both trades currently open.
So powerful are these running corrections that most of the time the price exceeds the 161.8% level and goes even into 261.8% or more. The 161.8% is the minimum distance to be travelled in order for the third wave to be an extended wave. In the event that the double three running was actually the b-wave of a zigzag, the c-wave to follow should end around the 161.8% level, even though an extension is not necessary in this case.
Other educational materials
- Different Fibonacci Levels Important When Trading with Elliott
- Trading Different Types of Extended Waves
- Placing Pending Orders When Trading with Elliott
- How to Trade 2nd and 4th Waves
- The All-Important B Wave Retracement
- What Are Corrective Waves?
Recommended further readings
- Primary commodity prices, manufactured goods prices, and the terms of trade of developing countries: what the long run shows. Grilli, E.R. and Yang, M.C., 1988. The World Bank Economic Review, 2(1), pp.1-47.
Related Articles