Aussie continues to show signs of life against its neighbor

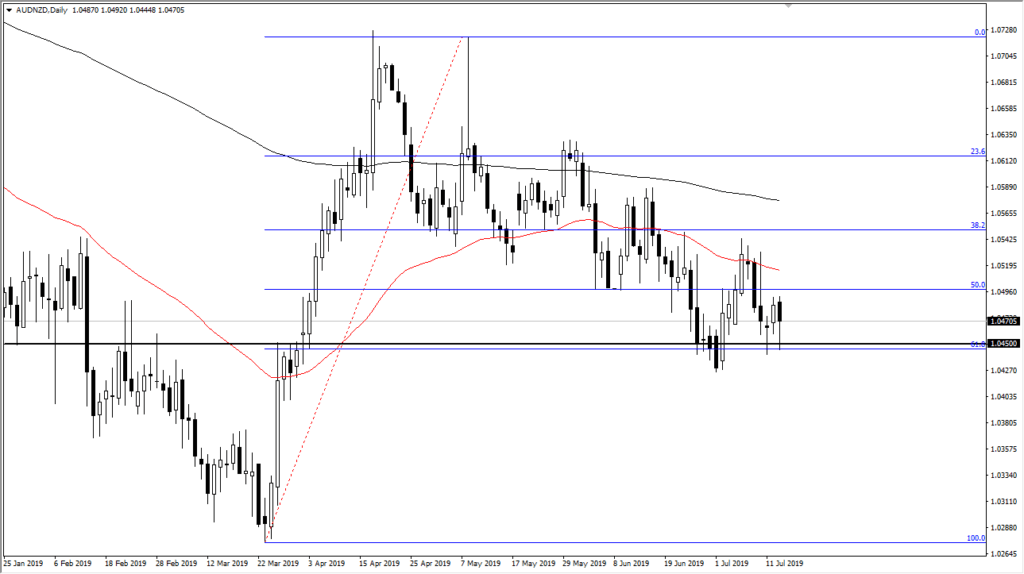
The Australian dollar has fallen a bit during the trading session on Monday against the New Zealand dollar, but more importantly has shown quite a bit of support at a place that should be crucial. The 1.0450 level has been important more than once, and it is also the scene of the 61.8% Fibonacci retracement level, an area that a lot of traders will pay attention to anyway.
With that being the case, we have a potential longer-term trade setting up in this market. Ultimately, if we get a failure of the pattern that I am looking at, it also sets up a reasonably longer-term trade as well. In other words, this is a pair that should start to make a move rather soon as we are at crucial levels.
The technical set up

AUD/NZD chart
The technical set up is that we are at the 61.8% Fibonacci retracement level, or the “golden ratio.” Beyond that, we have formed a couple of hammers now, as we approached the area that we had bounced from previously. It looks as if larger money is starting to come in at this area, and of course that will have a massive influence on where we go next.
If we were to break above the high of the session on Monday, this market probably goes looking towards the 1.0550 level. The 50 day EMA is just below there, so it may cause a little bit of resistance but I think ultimately we are trying to see this market turned around. That takes a lot of momentum and effort obviously, but it certainly looks to be in the cards.
China and Australia
there are economic concerns out of both China and Australia, with the Chinese economic numbers on Monday morning being slightly better than anticipated. This of course helps the Australian dollar as the Australian economy is so highly levered to the Chinese mainland as Australia supplies China with so many of the raw materials necessary to construct and produce. Beyond that though, we also have the Australian economic figures as far as employment is concerned, and that will also give the possibility of a move higher.
The move going forward
We have one of two potential plays here: if we break above the top of the hammer for the trading session on Monday, then we start buying. However, if we were to break down below the hammer from last week, then it opens up the door to lower pricing. Once we close significantly below the 61.8% Fibonacci retracement level, then the market is very likely to wipe out the entirety of the move meaning that we should go to the 100% Fibonacci retracement level. In other words, somewhere closer to the 1.03 handle underneath.
This can be expressed rather impulsively, so we need some type of long candlestick to tell us which direction to trade. This pair does tend to grind quite a bit though, as the two economies are so highly intertwined. Keep in mind that a certain amount of patience will be needed as this market can move rather slow.

