Bitcoin continues to shoot straight up in the air

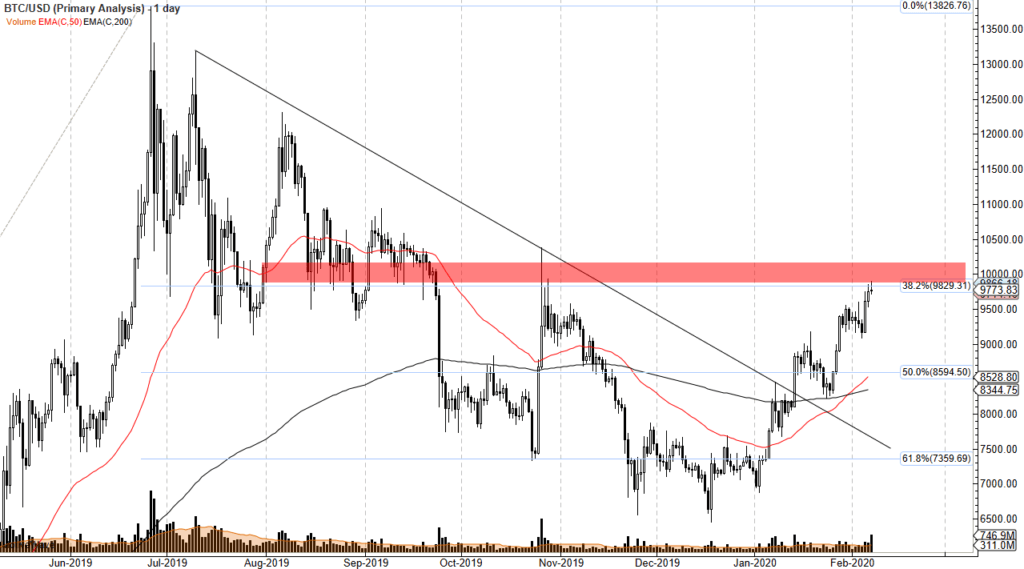
Bitcoin continues to look very impressive, as we continued the massive rally on Tuesday. However, we are approaching an area where you would expect to see some resistance, and no matter how you look at this chart, it looks overbought. This is not 2017, and as a result a little bit of reality should be put back into the chart sooner or later. After all, the horrific losses of last year should still be in the back of trader’s minds.

BTC/USD chart
Some potential causes
Some potential causes for this explosive move include Chinese sneaking money out of the country as capital controls are still very stringent. Perhaps there has been a new rush of money out of that country due to the trade war. This was one of the great catalysts during 2017 and could very well be what is going on behind the scenes.
Another potential reason could be the tariffs themselves, but not necessarily flowing out of China. It could be a simple return to Bitcoin offering a bit of an alternative investment, as people are looking for a way to hedge US dollar exposure. That being said, that is somewhat convoluted but it has happened in the past.
Another possibility is simply the fact that a lot of brokerage firms in the United States are getting ready to offer crypto currency trading. This could be people trying to front run that possibility, as it should bring in fresh money into the market, all things being equal. That being said, this could be a temporary situation.
In the end, the reason doesn’t matter
At the end of the day, the reason doesn’t matter because simply put we had been forming a base for quite some time. As you can see on the chart there was a channel that I have drawn previously, and if you flip through the historical articles on this site, you would recognize the mentioning of $6000 being an important resistance barrier. Once we broke above there solidly, the market was free to go much higher. Granted, I did suggest that $8000 was possible but I didn’t expect it to happen in two days!
Overthinking your trading situation can cause a lot of issues, so at this point it’s better to be thinking that the market is going higher, and therefore you don’t look to sell. Can the $8200 level cause a significant pullback? Of course it can. However, based upon what we have seen as of late this should be a buying opportunity. Beyond that, the $6000 level should now be rather supportive, so pay attention to that area as well. If we were to break down below the $6000, then things could look rather ugly. At this point we could get a pullback to that level and start a new range, or we could just simply be looking for more people to jump into the market and pick up value.
We could break above the $8200 level immediately for that matter. However, that would have me being very cautious because we see what can happen in those scenarios. If you don’t know what I’m talking about, look at January 2018.

