
Crude oil markets got absolutely hammered on Thursday as you know by now, with the West Texas Intermediate grade of crude oil losing almost 6% at one point during the trading session. During the Freddie session, we did rally during Asian trading and even somewhat during the European session. However, we have given back a bit of the gains, and this tells me that the crude oil markets will continue the downtrend.
Trend line break
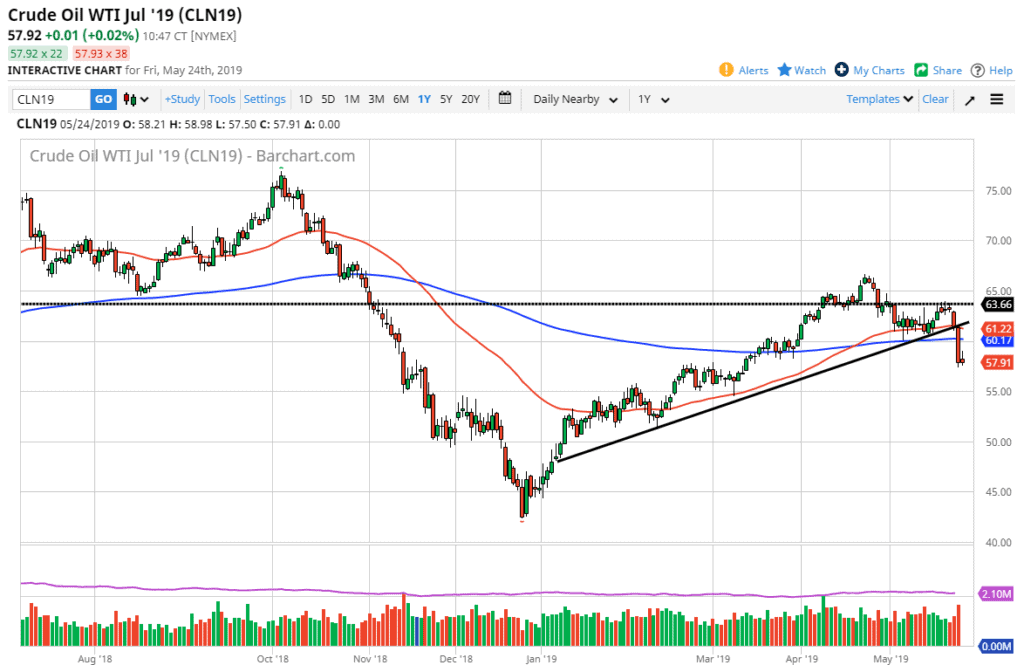
WTI Crude Oil
During the horrific trading on Thursday, we broke through a major uptrend line. That is without a doubt a major sign of weakness, and the fact that we tried to recover some of those losses and cannot hang on to it tells you that this trend line break is very likely to be a trend changing event. As you can see on the chart attached, the candle stick was very large.
These trend line breaks don’t happen very often, but when they do you should pay attention to them. A loss of over 5% isn’t something that happens all the time, so at this point it’s likely that we will continue to see negative pressure, and at this point I think it’s very likely that we will go looking towards the $55 level underneath, and perhaps even the $50 level after that. In the short term, it’s obvious that rallies will be sold, and Friday showed more of that.
Volume
Volume was very light on Friday which of course makes quite a bit of sense considering that Americans were going to be paying attention to Memorial Day more than anything else. Of course the counter to that is that there was massive volume on Thursday will we get the break down. Quite frankly I think that this shows that the market will eventually find reasons to go lower, as we worry about US/China trade negotiations, which of course suggests that people are starting to become worried about whether or not there will be global growth.
Crude oil falling makes quite a bit of sense, especially considering that demand seems to be slowing down based upon inventory numbers as well. Overall, breaking the trend line is always a negative sign, and of course the 61.8% Fibonacci retracement level near the $65 level has also shown a lot of resistance.
The main take away
Looking at the chart, I think it’s obvious that selling opportunities should continue to present themselves on short-term charts. The $55 level will be the initial target, but after that I think that the market probably goes looking towards the $52.50 level and then eventually the $50 level after that.
At this point in time, there is an obvious downward pressure that should continue to go forward, and it’s almost impossible to get bullish of this market until we break above the previous uptrend line which seems all but impossible after this massive move. Keep in mind that short-term rallies can be rather brutal in these bear markets but look for exhaustion and take advantage of that.


