
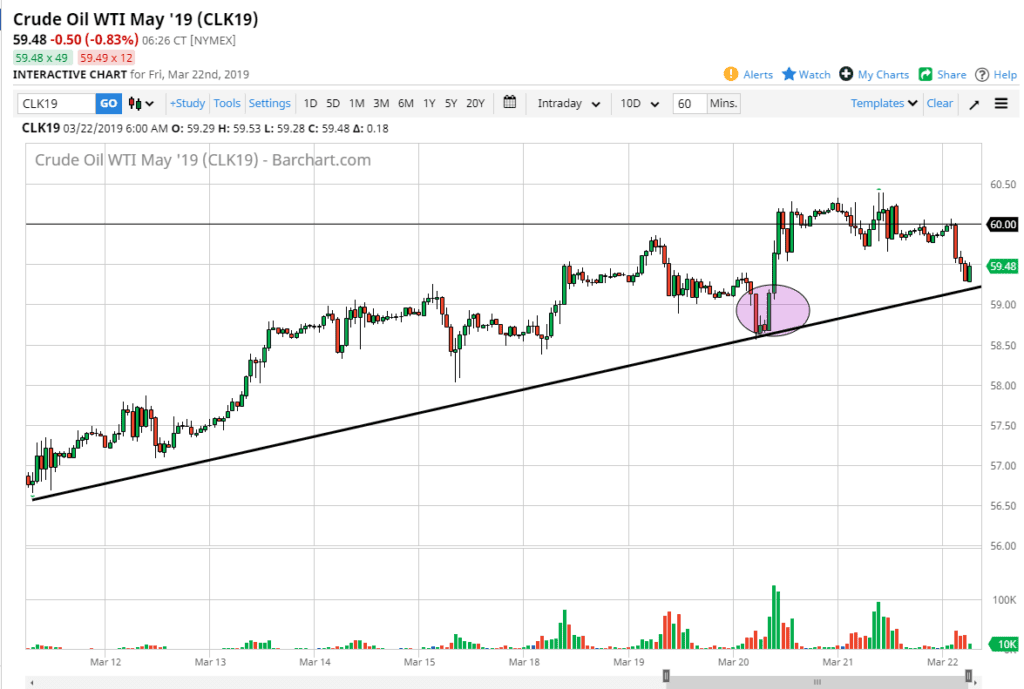
During the early Friday session, West Texas Intermediate crude oil fell quite a bit to reach down towards an hourly trend line that I have marked on the chart. This is an area that also feature support just below as well, so this bit of convergence can possibly be a sign that we are ready to continue to march towards the $60 level.
The importance of $60
Obviously, the $60 level has been important for several reasons. Not the least of which of course is the fact that it is a large, round, psychologically significant figure. However, beyond that we also have seen a gap filled in this area, so it will be interesting to see whether or not we can break out to the upside. With the pullback during early trading, it looks as if this might be a bit of a momentum building exercise for traders around the world to attempt to finally break through the $60.50 level.
If we were to break above that level, we would not only leave a significant resistance level below, it would also show just how bullish the market is from a momentum basis as well. Remember, crude oil has been extraordinarily resilient over the last several weeks, finding buyers and value hunters every time it dips.
WTI Crude
Trend line
The trend line is visible going back several weeks, so it’s worth paying attention to. After all, we are in and uptrend and have been for some time so an uptrend line of course is something that most of the market will be paying attention to. The question now is whether or not it will hold? It is because of this that we should pay attention to the $59 level, because although there is support just below there, the fact that we broke down below the trend line to reach that level would be a somewhat negative sign.
The one thing that could send this market below the trend line is the possibility of concerns about global growth, which of course there is plenty of that out there. On the other side of the equation though is the fact that the participants and OPEC have pushed back their meeting until June, meaning that production cuts should still be in effect between now and then. This was most recently seen in the inventory figures in the United States, as the draw down was almost 10 million barrels, but it was expected to only be about 500,000 barrels. That was extraordinarily bullish sign that sent the market crashing into the $60 level again.
One way bet?
When we look at the charts, it’s very obvious that a huge percentage of traders are willing to buy this market. Because of this, it is somewhat of a one-way bet, but nothing is absolute. This is why you need to pay attention to that $59 level, and of course the $60 level above which has been so crucial. Above the $60.50 level, it’s likely that prudent traders will add to a position as it will open up the door to $65 and beyond.


