Interested in where markets go? Watch this chart.

There are about a million different ways to trade the markets, perhaps even infinite. However, the market does have a few growth gauges that you can pay attention to. We are currently in the middle of earnings season when it comes the US stocks, so that of course has a certain amount of influence on equity markets, and currency markets are essentially flat, so at this point you need to spread your attention out to further reaches.
Professionals understand the importance of certain commodities
Currently, the crude oil market has taken off to the upside, but that has more to do with the Trump Administration announcing that they were going to end the waivers for countries that are buying Iranian oil, including both China and Japan which of course can have an effect on the global economy. However, it was also noted that the waivers will be ended in a year, so at this point it might be more bark than bite. However, it did send crude oil higher which is typically a good economic signal but that market is a bit skewed.
On the other hand, we have what is known as “Doctor Copper.” Copper is said to have a “PhD in economics”, as copper demand is typically driven by global growth and construction. This is particularly true in places like China and other parts of Asia which are growing exponentially. The thought goes that if the copper markets are going higher and are very bullish, then obviously there must be demand for that base metal. After all, a high-rise being built in places like Shanghai or Jakarta will require quite a bit of copper. Beyond that, electronics use a lot of copper and we all know that a lot of those very electronics come out of places like China. In other words, the higher the price for copper, the idea is that the economy is growing globally.

Copper daily charts
Up against massive resistance, and well… Support
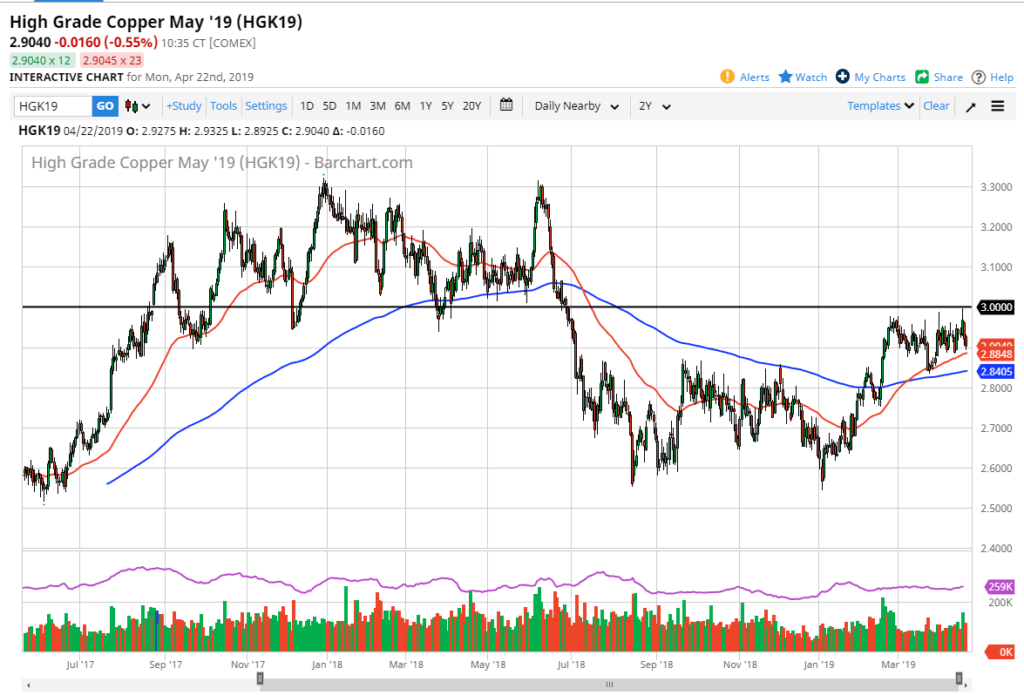
Looking at the copper markets, we have pulled back the last couple of days as we continue to grind between $2.90 and $3.00 above. Just below, we have a lot of support at the 50 day EMA pictured in red, as well as the 200 day EMA and blue. At this point we have recently had a “golden cross”, when the 50 day EMA crosses above the 200 day EMA, typically a longer-term “buy-and-hold signal.” At this point, we are pressing up against the $3.00 level which is massive resistance, as it was previous support. It’s also the psychologically important so don’t forget that as well.
Looking at the chart, it does appear that we are ready to bounce again and the longer we bounce around like this the more likely we are to see an impulsive move higher. If that’s the case, that should send most risk market such as equities higher as well, because it foretells potential global demand for copper, which as explained earlier can show whether the global markets are expanding. At this point, it certainly looks as if we are trying to grind to the upside, just as we are in several stock markets that are pressing major resistance. Keep an eye on copper.

