
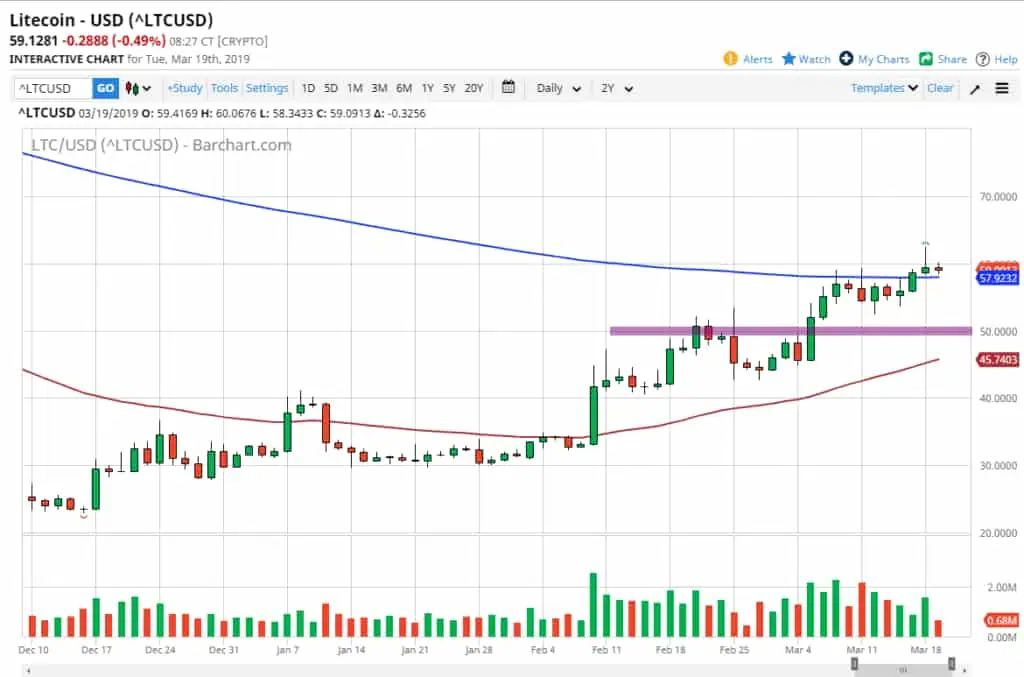
Looking at the daily Litecoin chart, we ended up forming a bit of a shooting star during the trading session on Monday to kick off the week. This is a very interesting candlestick, because it formed just above the 200 day EMA, which of course will attract a lot of attention. Beyond that, it was after a short term consolidation area that did break to the upside. So this tells us a couple of different things. To start off, it tells us that we did break out slightly, as we are now above the 200 day EMA. It also tells us that there is a little bit of trouble just above as well.
Get ready for value
When we look at this chart, the shooting star normally means that you are going to see a bit of a pullback, but quite frankly it looks as if we will continue to see buyers underneath. After all, we have seen the lot of support near the $55 level, and below there we should see plenty of support at the $50 level as well, because quite frankly it’s an area that will attract a lot of attention due to the fact that it is a large, round, psychologically significant figure. The market participants will continue to look at these round figures as an opportunity to get involved, especially the institutional ones that tend to be attracted to these levels anyway.
LTC/USD chart
The alternate scenario, a melt up
The other scenario is that we break above the top of the shooting star from the Monday session. That not only is bullish due to the fact that we are breaking above the candle stick, it shows that there is plenty of momentum as the buyers came back in and pressed the issue. That of course is a very good sign and should continue to give us plenty of reasons to go long. Beyond that, it would also show that we are comfortable with the idea of being above the 200 day EMA, so that in and of itself should be reason enough to go long.
Sub $50
The least likely of scenarios would be that the market breaks down below the $50 level, and perhaps even the 50 day EMA which is the red EMA. Ultimately, if we did do that, and I believe that it’s a very unlikely scenario, that would be an extraordinarily negative sign. The 50 day EMA is turning higher, and the 200 day EMA is flattening, after initially falling for quite some time. Both of those are positive signs for longer-term traders, so it’s very likely that we will continue to see buyers come into the Litecoin market for potential value. As Bitcoin has started to show signs of stabilization, that will have a bit of a “knock on effect” in the rest of the cryptocurrency markets, Litecoin of course would be included.
The overall take away
The overall take away from the Litecoin chart is that we will continue to see buyers jump into this market and take advantage of cheap pricing. Longer-term traders seem to be accumulating Light coin, and perhaps have been doing so for the last couple of months.


