Ripple continues to look bullish

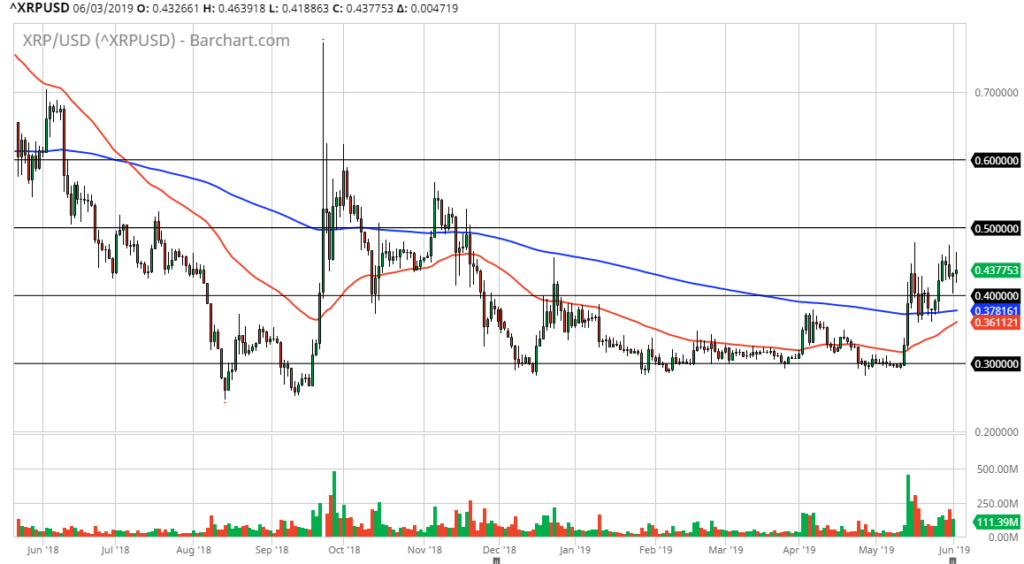
Ripple continues to show signs of life, as we go back and forth near the $0.43 level. Recently, we had broken above the $0.40 level, and that of course is a very bullish sign. However, there are several levels to pay attention to in this market, as the $0.10 levels continue to show both support and resistance. Remember, the crypto currency markets all tend to use the same directionality, and now that Bitcoin has broken out, it’s very likely that some of the other coins will rally as well.
Ripple following suit
Ripple of course is following suit, as our other alt coins. The fact that we broke above the $0.40 level is a good sign, but we also have to worry about the $0.50 level just above. Regardless, the most impulsive move that we have seen lately has been to the upside as shown a couple of weeks ago, and therefore it’s a good sign that we should continue to go higher. After all, if you look at the last several weeks, the markets simply had been quiet, so the fact that we got impulsive candle sticks to the upside suggests that there should be plenty of buyers looking to take advantage of this.
Orderly rally

XRP/USD
Looking at the chart, this has been a very orderly rally, so therefore I do believe that it is going to be sustainable. After all, we haven’t shot straight through the roof like crypto tends to do. This has been very steady so therefore there should be plenty of ability to sustain the inertia. We all remember what happened early 2018, and crypto currency traders simply have no interest in trying to repeat that meltdown. The fact that Ripple has taken its time will continue to make it an ultimately “safe crypto” asset, if there is one.
Major level just above
if we do break above the $0.50 level, then it’s a very positive sign as the “midcentury level” attracts a lot of attention. At that point I would be very aggressive, looking to buy Ripple as it would significantly break out and show signs of extraordinarily strong moves. In the short term, I believe that pullbacks are buying opportunities, with the $0.40 level offering plenty of support. The 200 day EMA, which is pictured in blue, show signs of support, and therefore I think it’s very likely that the market has changed attitudes.
The main take away
the main take away from this chart is that Ripple is starting to show signs of life, and although we have had a significant rally over the last couple of weeks, it has been steady and it hasn’t been out of sorts. Looking at this chart, you could even make an argument for some type of bullish flag forming, but at the end of the day the one thing that I do recognize is that we are above the 200 day EMA, which of course is a very bullish sign. I suspect a flood of new orders above the $0.50 level just waiting to happen as well.

