

How to Use the Apex in Expanding Triangles
 When dealing with triangles, there are some general things to consider. Such things happen in all triangles, no matter what the type, and refer to the measured move, the b–d trendline retest, or the apex of a triangle. The very notion of the apex of a triangle is somehow a mystery for many traders, when in reality it is such a simple and powerful tool to use. As mentioned in the previous article dedicated to triangles, the a–c and b–d trendlines are the ones that define the nature of a triangle. If the a–c and b–d trendlines are contracting, or moving towards a common point on the right side of the chart, the triangle is called a contracting one. On the other hand, if the two trendlines are expanding, the triangle is called an expanding one. The apex represents the intersection point of the two trendlines. In other words, when the a–c and b–d trendlines meet, that point is called the apex of a triangle. While it is more common for the apex to form on the right side of a chart, as contracting triangles form more often, the apex of an expanding triangle has many applications as well. The mere fact that it actually forms on the left side of the chart doesn’t mean that the information provided is useless.
| Broker | Bonus | More |
|---|
Ways to Use the Apex in an Expanding Triangle
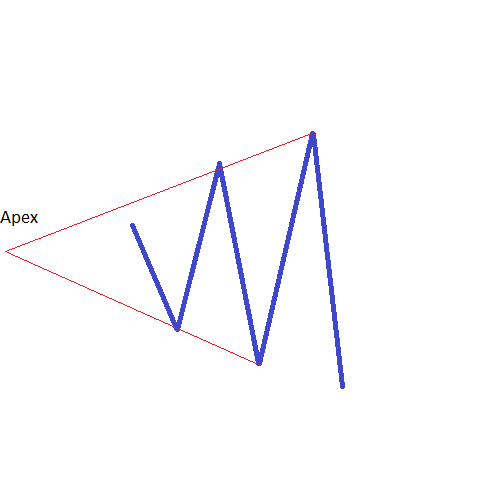
Because the two trendlines are obviously expanding, as the name of the triangle suggests, it means that the apex will be found on the left side of the chart. To be more exact, the apex is to be found before the actual expanding triangle time-wise. There are many ways to trade and interpret future price action based on the apex that formed in the past, and, basically, this is what technical analysis is: forecasting future patterns based on information that happened in the past. In this way, the apex of an expanding triangle is the perfect example of how technical analysis works.
Using the Apex to Find Important Support and Resistance Levels
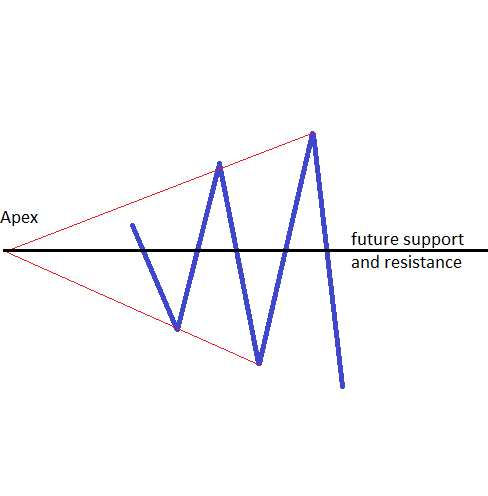
One way to interpret the apex of an expanding triangle is to use it to find future support and resistance levels. As a general rule, the longer the timeframe the triangle appears on, the stronger will be the support and resistance level offered. In other words, if the triangle forms on the monthly chart, the resulting support and resistance level will be by far more important than the one of a triangle on the hourly chart.
The way to find the apex of an expanding triangle is straightforward and simple. The first thing to do is to clearly identify the end of the first four waves in the triangle, the a, b, c and d-waves. This is not an easy task as it is not mandatory for them to end at the highs/lows, so be careful with the actual internal count of a lower degree. Assuming we know that, the next thing is to draw the a–c and the b–d trendlines. Both trendlines should be expanding on the right side of the chart, right? So how do you find the intersection point if they are moving away from one another? The correct answer to this question is to look on the left side of the chart. If the two trendlines are expanding on the right side of the chart, it means that they are actually contracting on the left side; so the intersection point or the apex of an expanding triangle is to be found prior to the triangle’s formation. After the apex is found, the thing to do is to take a horizontal line to mark the actual level. This line should extend on the right side of the chart, and just like that, we find the support and resistance level of such a triangle. The line of the apex should act as a classical support and resistance level. This means that it should prove support when the price is falling, and, if broken, it should turn into resistance. The other way is valid also, as resistance can easily turn into support.
Using the Apex to Tell the Nature of a Triangle
 The above interpretation of the apex of an expanding triangle is the classical one, and has many uses when counting waves with the Elliott Waves theory. It is, however, not the only one to be used. Triangles are further subdivided beyond the level of contracting and expanding ones. Based on the position of the apex, or where the apex actually forms in relation to the overall triangle, traders will know the nature of the triangle. This refers to what can we expect from price action that follows after the triangle is broken. Based on the apex position, the price action to follow will be limited in both price and time, or actually, will have no limitations. Such a statement is a powerful one, as if it has no limitations, then all traders need to do is to wait for the b–d trendline to be broken, and jump on a trade when it is retested. On the other hand, if the future price action is not supposed to travel far, then the break of the b–d trend line should be interpreted as a fake one, and actually the whole move should be faded eventually. This is a risky thing though, as it depends very much on the type of the expanding triangle and the timeframe that it forms on. If it is in a longer timeframe, fading such a break of the b–d trendline can be an expensive thing to do.
To solve this riddle, the measured move of a triangle comes into place. Such a measured move is to be applied here, and it usually refers to the Fibonacci ratio based on the longer leg of the triangle. However, because these are contracting triangles, the measured move should refer to the shortest one. An expanding triangle is a vicious pattern that forms when trading Forex markets, and it is important to know what to do with it. If the timeframe is long enough, like the daily one or longer, traders have enough time to interpret the triangle in the right way: its nature, whether the price to follow will be limited or not, the support and resistance level given by the apex, and many other important items of information. In doing that, traders can form an educated guess regarding future price action, and this is what technical analysis in general, and Elliott Waves in particular, is: having an idea about future price action on the back of patterns that have previously formed.
Other educational materials
- Defining Corrective Waves
- Use the Fibonacci Extension Tool in Elliott Waves Theory
- Different Fibonacci Levels Important When Trading with Elliott
- Trading Different Types of Extended Waves
- Placing Pending Orders When Trading with Elliott
- How to Trade 2nd and 4th Waves
Recommended further readings
- Mastering Elliott wave principle Hoboken, Bloomberg Press
- Charting Analysis for Commodity Futures. Catlett, L.B., 1977.
Related Articles