Ethereum continues to grind

When it comes to crypto currency, Bitcoin of course gets all of the headlines. However, the rest of the crypto currency market follows Bitcoin given enough time, and of course Ethereum has been no different. Because of this, it’s very likely that the average Ethereum trader needs to not only pay attention to the ETH/USD chart, but also the BTC/USD chart.
Recent consolidation

ETH/USD
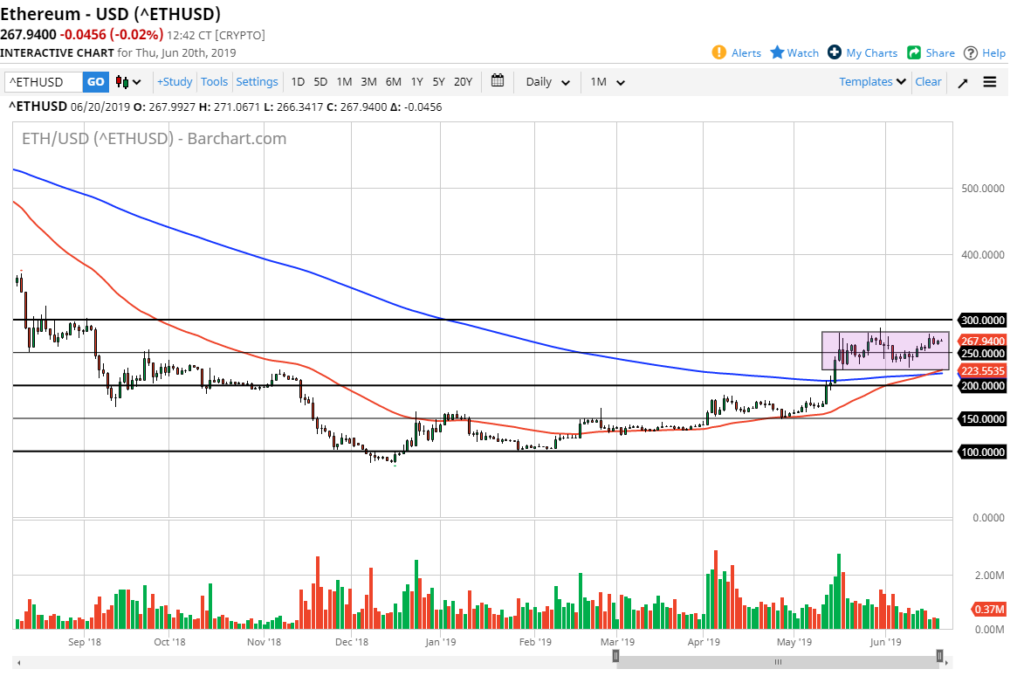
We have been in recent consolidation between the $225 level on the bottom and the $275 level on the top. We are closer to the top than the bottom, as we continue to relentlessly go back and forth between these couple of areas. However, there are a couple nuances to the recent consolidation that we should pay attention to.
Not the least of which is the fact that the 50 day EMA has crossed above the 200 day EMA, the so-called “golden cross.” As far as longer-term signals are concerned, there aren’t many out there that are more prevalent and upfront than this one. A lot of institutional money will follow these moves and hang on to the trade until across his back over, meaning it could be years.
Major resistance barrier above
Recently, we have seen the $300 level offer a lot of resistance. It of course is a large, round, psychologically significant figure but it is also an area where we have seen quite a bit of resistance previously, as well as support before then. The levels like $300 continue to cause a lot of volatility in this market, as the crypto currency market is no different than any other, in the sense that it does pay attention to round figures like that.
If we can break above there, then the market is free to go much higher, I suspect we would be looking at a move towards the $325 level, possibly even the $350 level rather quickly. Until then, this is probably a “buy on the dips” type of scenario, at least as long as we can stay within the present consolidation rectangle.
The play going forward
The play going forward of course is to buy this market every time it offers a bit of value. However, if we do break above the $300 level, I think that you will see more money ran into the marketplace, as well as more momentum. Remember, cryptocurrency tends to be attracted to momentum, so if we get a breakout here, you will probably see several of the alts do the same thing as well. That being the case, this is a very crucial chart, as it is considered to be the second-biggest crypto out there.
To the downside, if we were to break down below the $225 level, we probably go looking towards the $200 level which of course is also a large, round, psychologically significant figure in the scene of the recent breakout. Expect noisy trading conditions, but with the Federal Reserve easing its monetary policy, it makes sense that we would see money flush out of the US dollar and go looking towards other assets such as the crypto markets.

