Is Copper Starting to Reverse?

- Copper thought of as barometer for global economy
- Lower low reached
- Above 50-day EMA
The High-Grade Copper contract for the month of December has been relatively flat over the last 48 hours but has recently made a “higher low”. What’s most interesting about this is that quite often, the copper markets will give a bit of a heads-up as to where the global economy is heading. It has the moniker “Dr Copper” for a reason, as it is so often used in construction and industrial production overall.
As copper markets rise, this suggests there is more demand in various places, with a particular slant towards China. This goes counter to some of the economic news and wisdom that we have seen recently. After all, the US-China trade headlines continued to pummel the risk appetite around the world, but at the same time, copper seems to be trying to turn around. Is this a sign that the market is starting to price in the idea of some type of economic recovery?
Technical analysis

Copper chart
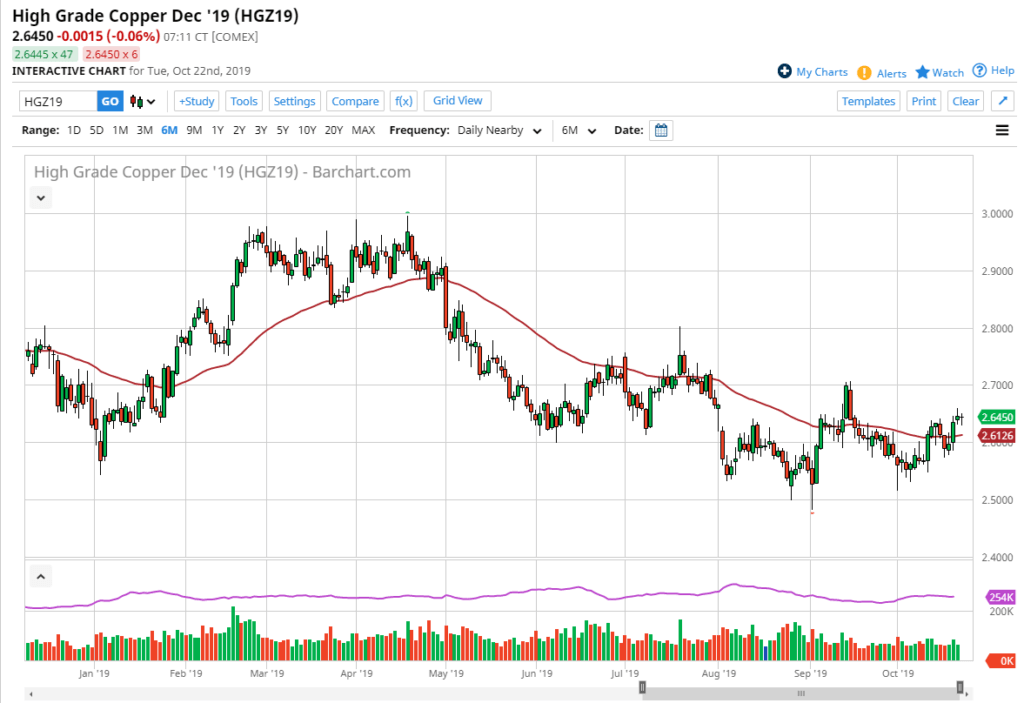
The technical analysis for the copper markets is a bit muddy at the moment, but recently it had been very negative. This suggests that the market is trying to build some type of base, or perhaps even turn back around. If you are playing any type of stock market around the world, you should be paying attention to copper, as it gives you an idea of whether or not growth is projected to come around the corner anytime soon.
The market has crossed the 50-day EMA, as shown in red on the chart. This is a relatively well-defined longer-term trend mechanism for the market, so paying attention to it always makes sense. The 50-day EMA is starting to turn a little higher, and it does suggest that perhaps the buyers are starting to step up their pressure. At this point, the $2.70 level above would be the target on a break above the highest from the Monday shooting star.
The fact that the Tuesday candlestick is starting to form a hammer suggests that we are fighting the downward pressure and could very well break out, given enough time. Pullbacks look to be supported near the $2.60 level, but if the market were to break down below there, then it could start to carve out a harder floor closer to the $2.50 level yet again.
Keep an eye on this market as it will indicate where a lot of markets will go. It’s particularly worth noting when it comes to emerging markets around the world, as commodities are so highly influential in places such as Australia and Asia.

