British Pound Hanging Onto Uptrend

- British pound continues its bullishness
- 50-day EMA just above
- 30 level breached
As interesting as it sounds, the British pound continues to be very resilient. The UK had delivered a horrible retail sales figure on Friday, which is a sign that perhaps the Bank of England will continue to have to look at the idea of loosening monetary policy.
That is obviously an issue for the British pound itself, but the market is not completely sold on the idea,. This explains the hesitation to break down the currency.
Technical analysis

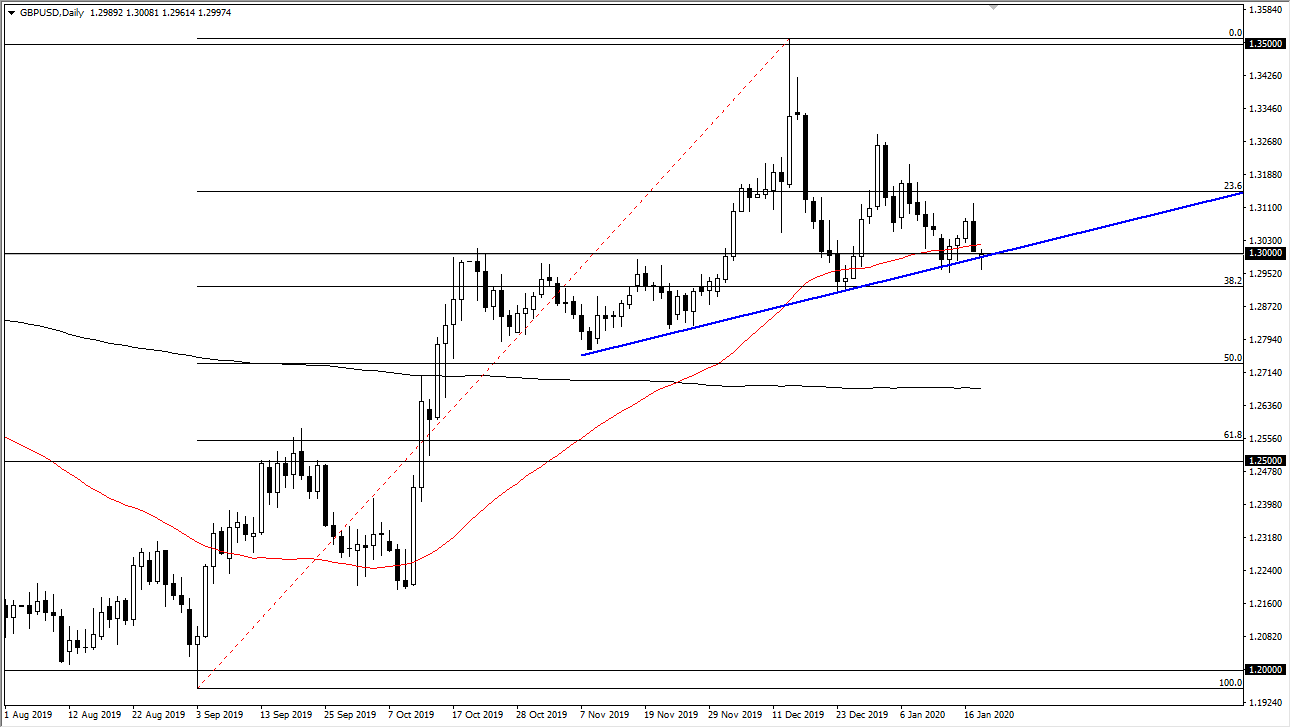
GBP/USD chart
The technical analysis for this pair is a mixed bag lately, but that’s not a huge surprise when considering all of the noise going on around it. After all, the Brexit situation is a neverending source of volatility, and that has been one of the major issues when it comes to the currency markets around the world for some time.
In the chart, one can clearly see that the asset continues to chop around and show signs of exhaustion occasionally, followed by a quick turnaround. The trend line in this chart had been pierced early during the day on Monday, but it has since seen some value hunting below the 1.30 level underneath.
If the market breaks back above the 50-day EMA, it would be a very bullish sign as it would show the market recapturing a major technical indicator. Breaking above then sends the British pound looking for the top of the Friday session, which is closer to the 1.3110 level. This has the market continuing its attempt to reach towards the 1.35 level again.
However, if the market does break down below the lows of the trading session, then the market may go looking towards the 1.28 level, given enough time. That obviously would be very negative for the British pound.
It will be interesting to see how this pair behaves on Tuesday, as it could give a sign as to where it is going longer-term.
Hanging by a thread
The takeaway from this technical analysis is that this asset pair is hanging on by a thread. If it can continue to go to the upside, it needs to move right now. If it can break out above the highs from Friday, then traders could have something to look forward to. Otherwise, if it were to break down, the market will probably go looking towards the 1.28 level initially, and then the 200-day EMA underneath, which is closer to the 1.27 level.
A decision is needed about the British pound rather soon, so the Tuesday candlestick may give market participants a “heads-up” as to what the next move is. While Monday looked bearish, major technical levels were still not broken.

