Crude Oil Markets Consolidate Ahead of Inventories Figure

- Stuck between two major moving averages
- Hammer for trading session on Tuesday
- Larger consolidation area
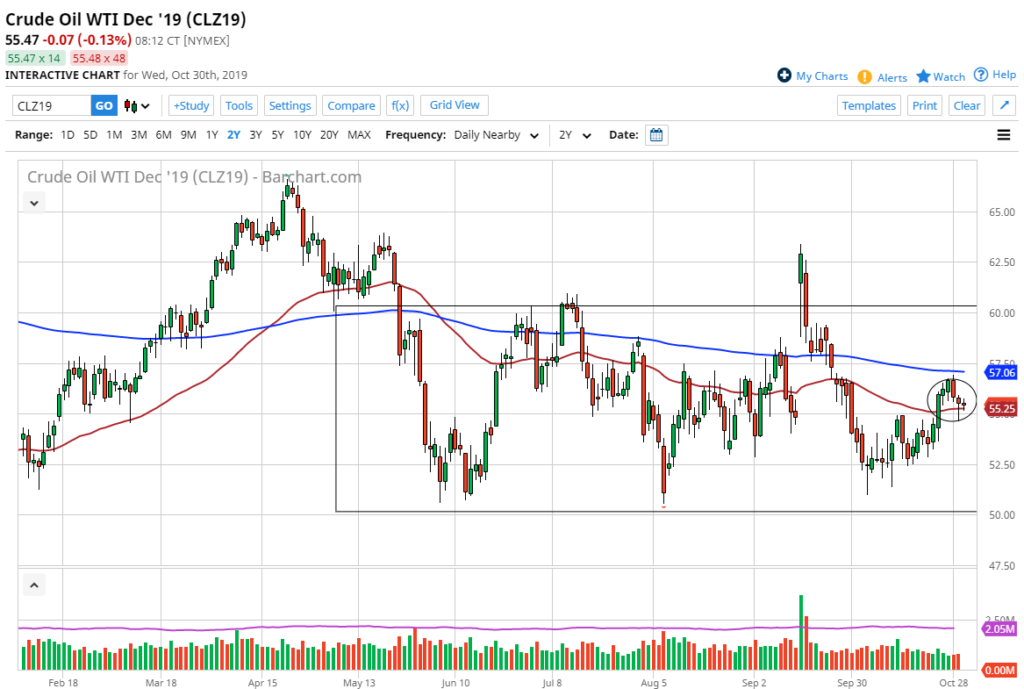
The West Texas Intermediate Crude Oil market has been consolidating over the last several days ahead of the inventory figure. As we head towards that announcement, the market is sitting just above an area that has offered a lot of interest. Because of this, the market looks as if it is trying to build up enough momentum to make a move in one direction or the other, with a couple of different destinations in mind.
Technical analysis

WTI crude oil chart
The technical analysis for this market is relatively benign and flat in the short term, as the market is trading between the 50-day EMA painted in red and the 200-day EMA painted in blue. Both of these moving averages tend to attract a lot of attention, so when the market finds itself between these two moving averages when they are flat, this suggests that the market is going to continue to be very sideways and lackluster, to say the least. Ultimately, this is a market that is looking for some type of catalyst to move forward.
The 200-day EMA is currently trading at the $57 level, an area that will cause resistance based on the fact that the market has pulled back from there previously, and there is also a gap from several weeks ago in that vicinity. However, the market has recently broken above the significant $55 level, an area that had been stubborn as far as selling pressure is concerned.
If the market does, in fact, break above the 200-day EMA, it’s very likely to continue going towards the $59 level. This is the beginning of a range of resistance that extends to the psychologically significant $60 handle. To the downside, the $55 level has shown itself to be supportive in the last 24 hours, and there is a lot of choppy action between there and the $52.50 level. In other words, it’s going to be much easier for this market to go higher rather than lower. Having said that, the inventory number could be a catalyst to shake this market up.
The trade going forward
The trade going forward in this market does tend to lean in one direction right now. The market pulling back should find plenty of support near the $55 level, and a poor inventory number could give you the opportunity to start buying oil at cheaper levels.
The alternate scenario is that if the inventory number is extraordinarily bullish, the market should break above the 200-day EMA. If that happens, it is also a buying opportunity based on momentum. As far as selling is concerned, that certainly would be the most difficult position to attempt.

