Ethereum at a Potential Crossroads

When it comes to crypto, Ethereum plays a bit of a backseat but it is still considered one of the larger coins. That being the case, we always have to pay attention to what’s going on in Bitcoin. This gives us a bit of a “barometer” when it comes to crypto. In that sense, Bitcoin functions very much like the US dollar does in the Forex world.
Confluence of Levels
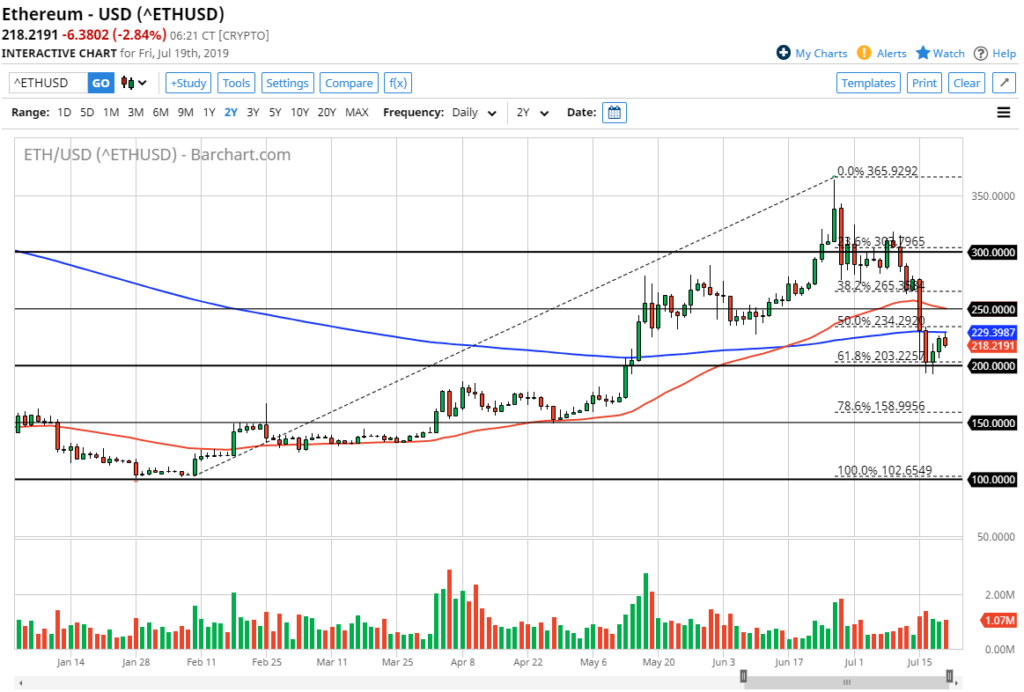
When you look at this chart, there are several things going on at the same time. After all, we have recently seen a significant selloff, and unlike Bitcoin, we haven’t seen a meaningful bounce. Yes, we have bounced a bit but have not been able to clear the 200 day exponential moving average. While not the be-all and end-all indicator, the 200 day EMA does affect how people look at a chart as being in an uptrend or downtrend. With that being the case, it is offering just a bit of resistance currently as we are pulling back early on Friday.
Underneath we have the $200 level, which of course is psychologically important. We also have the 61.8% Fibonacci retracement level in the same area, which obviously is supported. So the question now becomes whether or not all of these levels will provide clarity, or if they will make Ethereum even more erratic?

Ethereum Daily Chart
Round Number and Fib
All things being equal, I prefer to go with the round number and the Fibonacci level winning the argument. I find that the 61.8% Fibonacci retracement level will always attract a certain amount of attention, especially considering that we had been in an uptrend. That being said, if we were to break down below the Wednesday candle, that would, of course, be a negative sign, and could send Ethereum down to the $150 level. It is because of this that I think we are going to make a decision relatively soon, at least as to where the next $50 or so comes from.
Trading Ethereum Moving Forward
If we can close above the 200 day EMA, then I am a buyer. I suspect that the $250 level will offer a bit of resistance, but the significant resistance that I think will cause more trouble is closer to the $265 level where we had broken down from. That being said, if we break above the 200 day EMA on the daily close I am relatively confident we make it.
On the other hand, if we were to break down below the Wednesday candlestick, roughly $194, then I think the market probably unwinds somewhat drastically. At that point, we would be looking at a move towards the $150 level. If Bitcoin is also falling, that adds more credence to that trade. Keep in mind that I am waiting for a daily close to make my decision, so I won’t necessarily be biting on the trade as soon as it fires off. I need confirmation, knowing that traders went home with conviction in one direction or the other.

