New Zealand Dollar Winding Up for Bigger Move Against Yen

- Larger wedge pattern being played out
- Downtrend formed
- Proxy for safety trade
The New Zealand dollar has fallen again during the trading session on Tuesday, reaching down towards the ¥68 level and breaking the back of the hammer that had formed during the previous session on Monday.
While not particularly spectacular, this does show the “push and pull” of this pair, which makes perfect sense in the environment we find ourselves in. With so many “risk-on/risk-off scenarios” out there, it’s obvious that we should be paying attention to pairs like this, as they tend to move back and forth with the overall attitude of traders around the world.
Japanese yen’s role in the economy
The Japanese yen has a special place in the forex world. It is where traders go when they look for safety, as the Japanese Government Bond (JGB) market is extraordinarily large and widely consumed by the local population. In fact, it’s a great proxy for where to hide your money when liquidity becomes important.
This is where the Japanese yen comes in because it is needed to purchase those bonds. Beyond that, quite a few large and highly levered funds will borrow money from Japanese banks because of low interest rates. When markets start misbehaving, they pay back those loans as quickly as possible.
Because of all this, you will see the Japanese yen strengthen when bad news hits the headlines. In this particular currency pair, on one side of the fence you have the New Zealand dollar, which is highly levered to the Asian economy.
On the other, you have the safety of the Japanese yen. With the US/China trade talks going nowhere fast, it’s probably only a matter of time before people start running for safety again. This should be a continued bearish factor in this currency pair.
The technical analysis
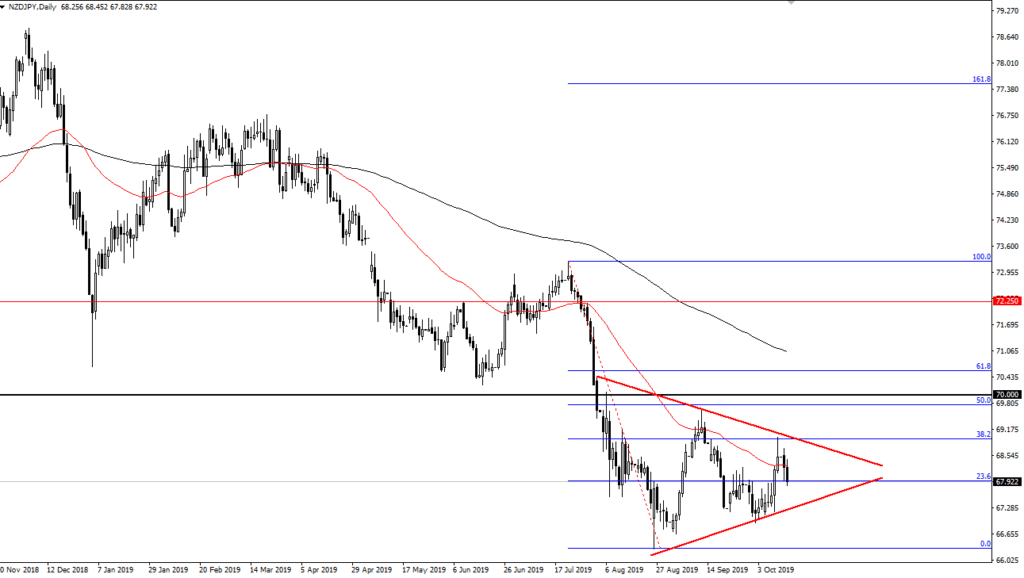
NZD/JPY chart
The technical analysis for this pair currently suggests that the wedge marked on the chart is the market trying to build up enough pressure to make a bigger move. If the top of the wedge is broken in bullish sentiment, the first major resistance barrier will be the ¥70 level, followed by the 200-day EMA, which is currently trading closer to the ¥71 level. However, if the overall trend continues and we break down below the bottom of the wedge, the market is more than likely going to go looking towards the ¥65 level.
All things being equal, waiting for a breakout of the wedge is probably the best way to play this market. Certainly, there must be more confidence in a move lower as the downtrend has been so prominent over the last several months. Either way, a daily close outside of this wedge should point the way for the next move.

