USD/CAD Reacting to Weak Oil Markets

- Canada’s major export is crude oil
- Volatility in crude markets continues
- OPEC disappoints
The US dollar has been a bit volatile during the trading session on Thursday, as the crude oil markets got absolutely shellacked during trading, losing almost 3% at the absolute lows. At this point, the Canadian dollar is taking it on the chin against several other currencies, but the USD/CAD pair is particularly interesting, considering that we have a nice technical setup point.
Extension of the overall trend?
The overall trend has been higher over the longer term, but it has been very volatile over the last several months. This is a particularly choppy market due to the fact that the economies trade so much with each other. That being said, there is a lot of necessary currency trading to facilitate economic functions, distorting some of the speculative nature that some of you are engaged in.
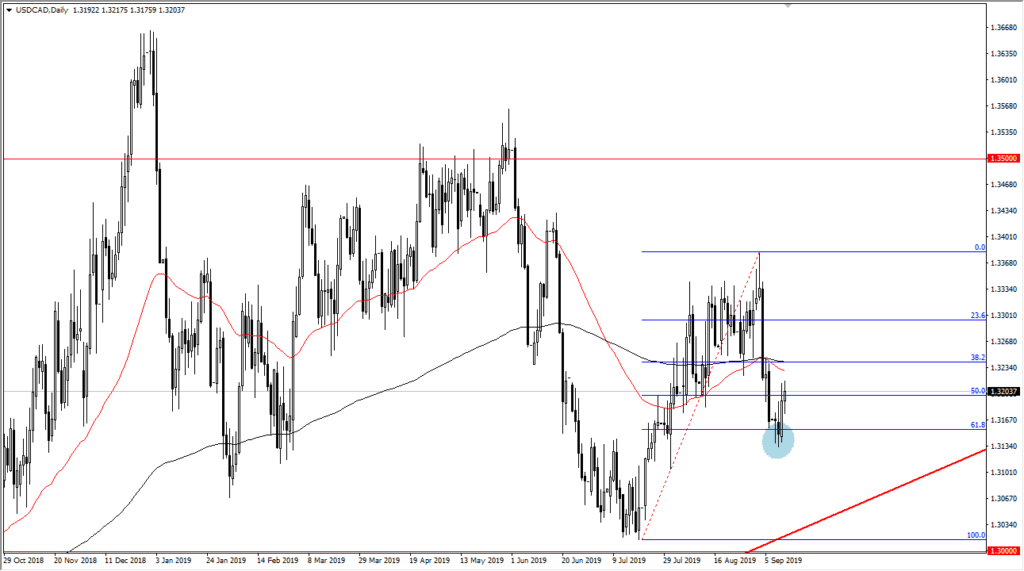
We have recently pulled back but are starting to show signs of strength again as oil rolls over. With that, the trend line underneath has held. In fact, it hasn’t even been tested. Ultimately, this is a market that should find plenty of buyers. That’s not only due to the crude oil markets, but also to the fact that if there is a lot of economic tension in fear out there, a lot of money will go into the US bond markets.
Technical analysis

USD/CAD daily chart
The USD/CAD pair pulled back significantly over the last couple of weeks, but it has bounced in the last 48 hours to show signs of strength again at the 61.8% Fibonacci retracement level. During the day on Thursday, markets have broken above the 1.32 level, which is a relatively strong sign. The 50-day EMA and the 200-day EMA are essentially flat and just above, so I would not put as much weight on those moving averages as one might expect.
Pay attention to the crude oil markets, because if they continue to fall, that also will support the bounce that we have seen. Quite often, the 61.8% Fibonacci retracement level will attract a lot of trading order flow, just as we have seen over the last couple of days.
How to trade
Obviously, this is a market that can’t be sold quite yet. We may get a short-term bounce in the crude oil market, which could send this market back down. But as long as we hold above the loose circle on the chart, which is the 61.8% Fibonacci retracement level, this should be a market that continues to attract buyers. This will be exacerbated and helped by the idea of global growth concerns, as the US dollar is without a doubt one of the premier safety currencies in the world.
Money has been flying back into the bond markets over the last couple of days, so pay attention to that as well. It’s likely that Canada will have to cut rates, but so will the Federal Reserve, so we may continue to see choppy behavior in this market, but with an upward tilt.

