How to Treat Patterns with Failures in Forex
Elliott discovered multiple types of patterns a market can form, and one of the most powerful types is those that have a so-called failure, or patterns that fail. What is this failure, and why is it so important to know that these patterns even exist? A pattern with a failure shows the inability of the price to move beyond a specific level. There are many situations where price fails to do that, and most of them are met in corrective waves. The reason patterns with failures are so important is because they are actually a sign that the market is going to make an explosive move in the opposite direction. Most of the times an important top or bottom is to be found after such failures occur. Therefore, knowing when a pattern with a failure forms, and what the implications for future price action are, is vital for the overall trading process using the Elliott Waves theory. Outlined below are the most important things to know about patterns that contain a failure.
| Broker | Bonus | More |
|---|
Two Types of Failures
Elliott discovered that failures can appear in two situations, and these situations are named by the nature of the overall move: impulsive or corrective. So patterns with failure appear in both impulsive and corrective waves, with the most common types happening in corrective waves.
Failures in Corrective Waves

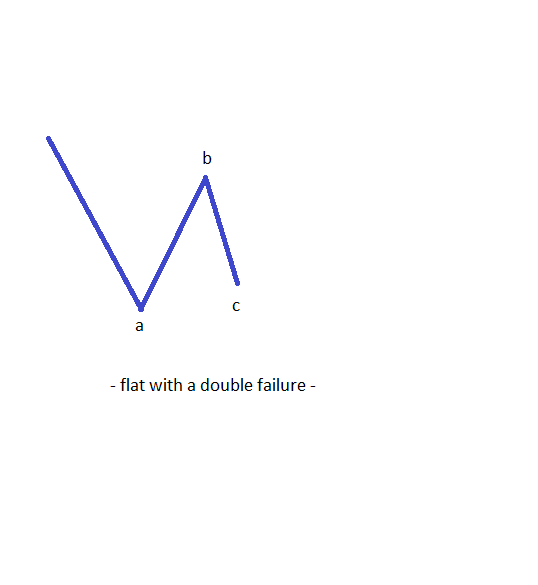
The second type of flat, the one with a double failure, implies that the c-wave fails to completely retrace the previous b-wave. This is an even more powerful pattern than the previous one, and it usually happens so fast that traders are taken completely by surprise. If the b-wave in a flat retraces between 80% and 100% of the previous a-wave, there is only one flat that is subject to a failure. This happen again when the c-wave fails to completely retrace the previous b-wave. The last category calls for the b-wave to retrace between 100% and 138.2%, and in this case we also have a single possibility for a failure to form. Again, it refers to the c-wave, which fails to completely retrace the previous b-wave. All the flats with failures are more powerful than the other types of flats that the market may form (with the exception of a running flat, of course!), and in particular, the flat with a double failure. Therefore, from now on, on seeing such a pattern, just remember that the real move you want to catch is coming in the opposite direction from the one the flat is actually travelling in.
Failures in Impulsive Waves

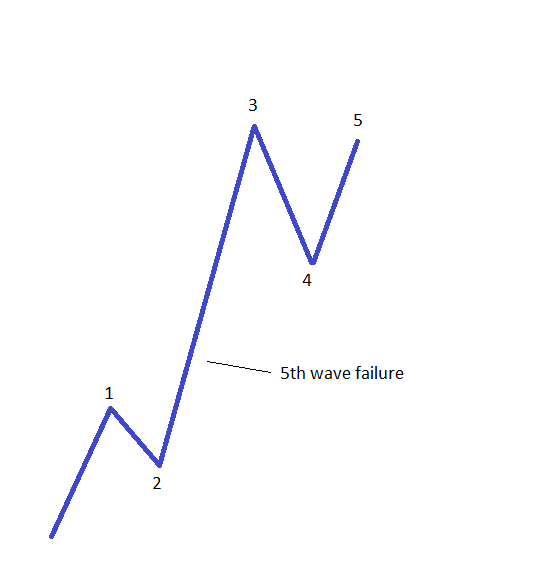
Another very important factor is the timeframe this pattern appears on. If it is forms on the monthly chart, for example, you can imagine the significance of the trend to follow, as it will have huge implications for years to come. On the other hand, a fifth-wave failure on the hourly chart should be viewed as a pattern that shows a reversal taking place, and a trend of a lower degree should start from that moment on. As you can see, patterns with failures are quite common with Elliott waves, as flats are quite common. There are no less than nine type of flats, not including the running flat here; and of those types, four of them are subject to at least one failure. All in all, every time there is a pattern with a failure that forms, it should be considered as a strong signal that a powerful move in the opposite direction is about to follow. You should make sure you position for that move, even at the expense of not trading the c-wave in a flat.
Other educational materials
- Trading with the Apex of a Contracting Triangle
- Types of Contracting Triangles
- Special Types of Triangles
- Types of Expanding Triangles
- Trading with X Waves
- The Concept of a Running Correction
Recommended further readings
- Fundamentals of investments: valuation and management. Dolvin, Steven D., Bradford D. Jordan, and Thomas W. Miller Jr. 2009.
- An integrated stock market forecasting model using neural networks. Weckman, G. R., Lakshminarayanan, S., Marvel, J. H., & Snow, A. (2008). International Journal of Business Forecasting and Marketing Intelligence, 1(1), 30-49.


