Bitcoin continues to rotate sideways

Bitcoin has done very little over the last couple of days, after shooting higher about two weeks ago. That being the case, it’s a question of whether we are in an accumulation phase, or are we in the distribution phase? The main difference of course is that either people are trying to accumulate more and push to higher levels above and take advantage of what is rapidly becoming a decent uptrend, or perhaps they are looking to get out of the market with a small gain or mitigate some of the losses from previous long positions.
The big picture
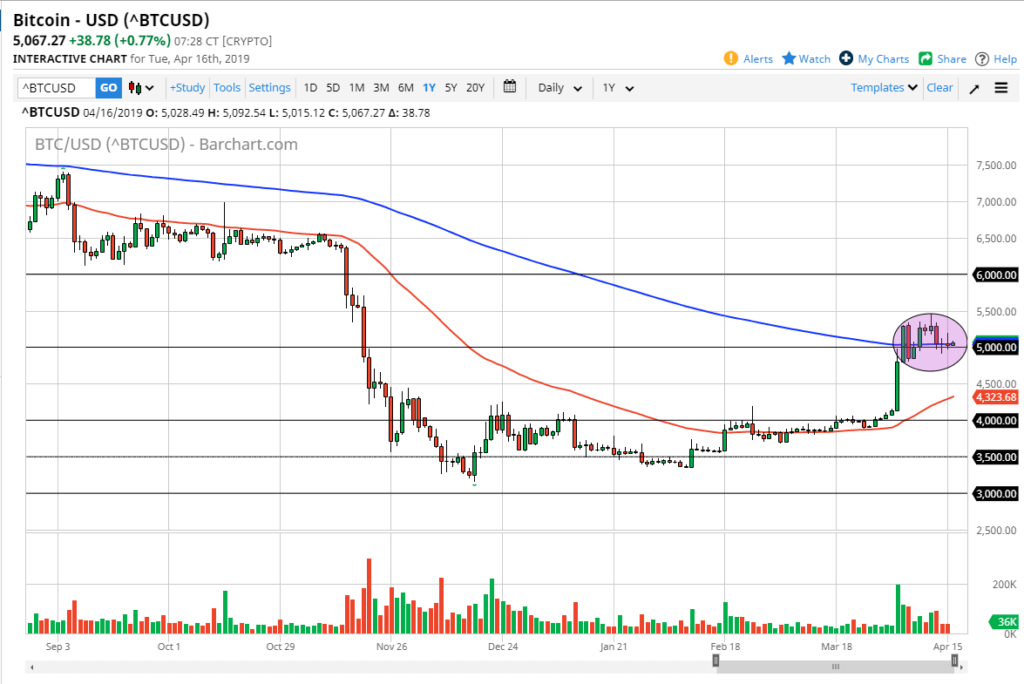
The big picture of course is that we have recently seen a nice shot higher. The fact that we have gone sideways overall typically is a good sign, because it means that the market is comfortable with the $5000 area that we have highlighted on the chart. Beyond that, we also have the $5000 level acting as a bit of a magnet for price which makes sense as most humans are attracted to large, round, psychologically significant figures. Furthermore, price has flattened out right along with the moving average and adding more interest to the market is that the red 50 day EMA underneath is turning higher. Ultimately, there are lot of bullish signals on this chart.
To the upside we have the $6000 level which should offer massive resistance, not only because of the large, round, psychological importance of the figure, but also the fact that the level was previous support for a very long amount of time, which means there will be a lot of “market memory” attached to the chart at that level. With that in mind, it makes sense that we will probably struggle significantly when we get there. A break above the $6000 level could get this market screaming to the upside.

BTC/USD daily
The short term
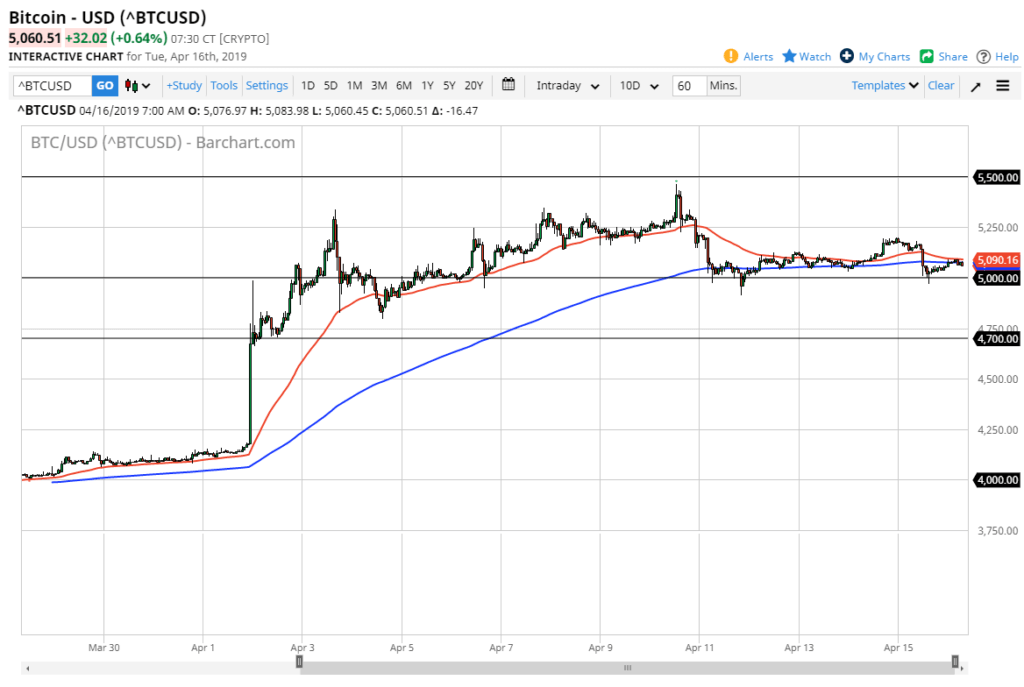
Short-term charts, in this case the one hour chart, have shown a couple of important levels that we have been bouncing around for the last several days. For example, the $4700 level has acted as support, with the $5000 level of course offering a bit of a magnet for price in both directions. Above there, we have the $5500 level which of course is an area where we’ve seen resistance.
You should notice that the moving averages are starting to flatten out, so that obviously isn’t a good look for a bigger trade. At this point, it looks very likely that the market will continue to bounce around these various levels until we get enough resolution to break out of this range. Right now, it looks as if the range will hold so there isn’t a huge rush to go “all in” when it comes to Bitcoin.
BTC/USD hourly
The main take away
The main take away from Bitcoin is that we have had a nice run higher, but at the end of the day we still have a lot of confusion. If you are looking to buy Bitcoin at this point, you should be thinking more along the lines of a longer-term trade than anything else. There is going to be a lot of noise, but quite frankly the more noise we see in this area, the better it is going

