Bitcoin gives up early gains on Monday

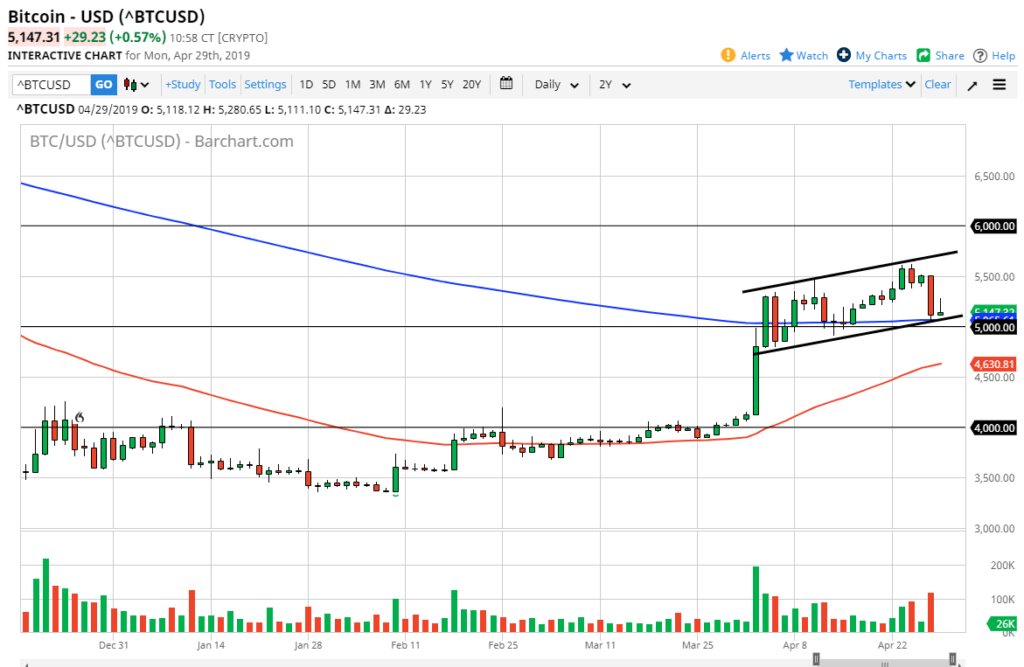
Bitcoin continues to be very volatile but has recently made a significant surge higher. However, it should be pointed out that Monday’s action wasn’t that impressive. We initially when higher but then gave back the gains to continue the negativity that we had seen over the weekend. At this point, we are sitting above the $5000 level which of course will attract a lot of attention, but there are also other technical things to pay attention to on this chart as well.
Uptrend

BTC/USD chart
Looking at this chart, there is still an uptrend to be paid attention to over the last several weeks. This is a market that is very volatile, and as a result Bitcoin should be looked at through the prism of the longer-term move. This is because the spreads can be extraordinarily wide depending on how you trade it, and of course it is such a young market.
Looking at the chart, you can see I have drawn a potential bullish channel, but at the same time we also have the shooting star looking candle stick sitting on top of the uptrend line, the 200 day EMA, and of course the $5000 level. With all of that being said it’s very likely that we are going to see a significant move in one direction or the other. Based upon what we have seen as of late, it’s very likely that we will continue to expect a lot of volatility. The 50 day EMA is below, and it should offer quite a bit of support below at the 4600 level as well. Quite frankly, the candle stick on April 2 show just how much underlying demand there could have been. It was a very bullish candle stick. These types of impulsive candle stick stone happen very often, so when they do you should notice them. This is what started this massive move.
The barriers above
The barriers above include the $5500 level, and then of course the top of the bullish candle stick. Beyond that, we have the $6000 level where I believe we will have the real fight. The $6000 level is massive resistance, or at least it should be based upon what is known as “market memory.” This is the phenomenon that says, “what was once support is now resistance.” Or, sometimes it is stated “what was once the floor is now the ceiling.”
If we can break above the $6000 level, that would be a crucial turn of events in this market and send Bitcoin market into a longer-term “buy-and-hold” phase. That being said, I believe it is going to take a significant amount of momentum to finally break that barrier. With that in the back of my head, I look at this chart and recognize that it will probably be more choppy trading in a back-and-forth manner, but with an upward bias. I believe that those barriers above will eventually be broken.
The main take away
The main take away of course is a bit of a bullish attitude continues to be a major part of what goes on. After all, the market had been beaten down for so long that it makes sense we will continue to develop what looks a whole lot like an “accumulation phase.” With that, I believe that the market is one that continues offer value on these dips.

