US Dollar Likely to Struggle Against Japanese Yen After Talks

- China wants to “speak again” before signing deal
- Could bring in a “risk-off” scenario
- 200-day EMA tested
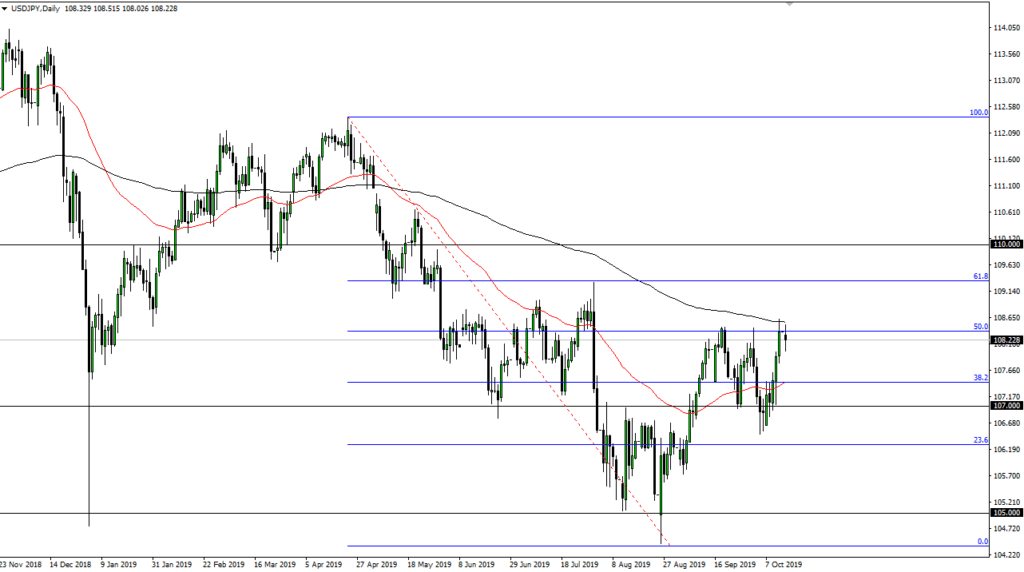
The US dollar has reached towards the 200-day EMA during the trading session on both Friday and Monday and has also pulled back. At this point, it’s highly likely that the market will reach back towards the 50-day EMA, painted in red. The 200-day EMA is very possibly going to loom large, as it does tend to define the overall long-term trend.
Risk-on/risk-off
The USD/JPY pair is significantly influenced by risk appetite, as the Japanese yen is essentially the “ultimate safe-haven currency” in the forex markets. In other words, as people worry about global growth or geopolitical situations, they tend to pick up the Japanese yen to pay back highly levered loans to Japanese banks. As Japan offers almost completely free loans, that is one of the first places that large firms look to borrow. When they run into a bit of trouble, they look to get out of the market and pay back those loans.
Longer-term trend

USD/JPY chart
Looking at the longer-term trend, one can use the 200-day EMA as resistance close to the ¥108.50 level. That’s an area that has offered resistance more than once, so the fact that the market has struggled on Monday at that level is not much of a surprise. Beyond that, this is now the fourth attempt to try to break out above there.
Furthermore, the 50% Fibonacci retracement level can be found there as well, so it could turn the market back around. As a result, one should probably look at the possibility of a continuation of the longer-term move. To the downside, this could open the door to the ¥107 level, which is an area that has offered significant support. All things being equal, it’s very likely that this market will continue to chop around in the overall noise in this general vicinity.
The trade going forward
The trade going forward is relatively simple. A break down below the bottom of the candlestick could send this market back down towards at least the 50-day EMA, painted red on the chart. After that, it could move to the aforementioned ¥107 level. A break down below it would open the door to a potential ¥105 level. Alternatively, if the market were to close on a daily chart above the 200-day EMA, then it’s very possible that the market could go looking towards the ¥110 level, with this being the next large, round, psychologically significant figure that traders will be paying attention to.

