New Zealand dollar overbought yet bullish

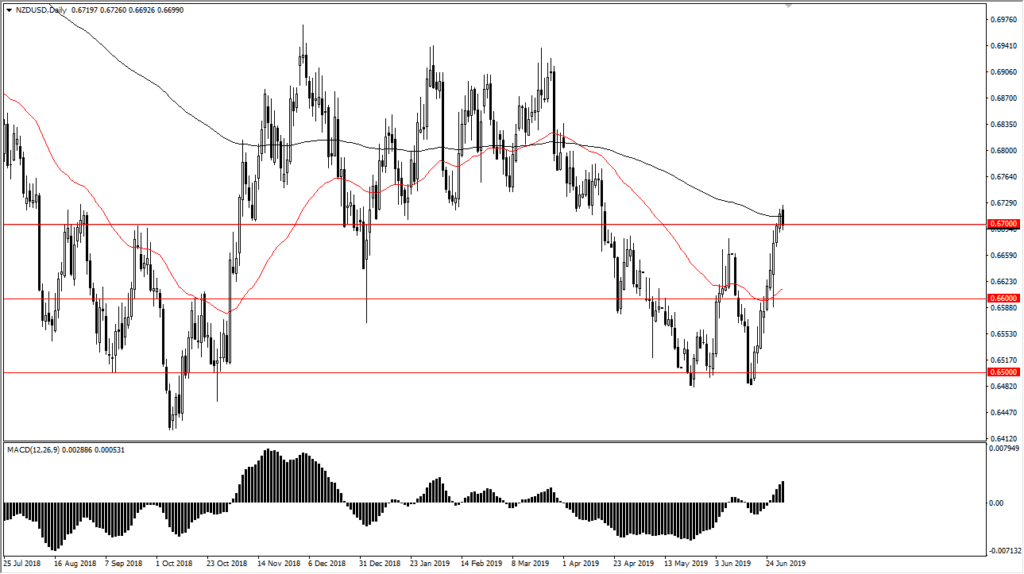
The New Zealand dollar has pulled back a bit during trading on Monday, after breaking above the 0.67 level against the United States dollar. The move over the last several days has been rather extraordinary, as we have shot straight up in the air. This has created a bit of an overbought condition, but that doesn’t necessarily mean that we should be sellers. After all, we have recently seen the market break out to make a “higher high”, and you can’t go in one direction forever. A pullback is actually going to be healthy for the buyers.
200 day EMA
The 200 day EMA is sitting right in the middle of the candlestick, and the fact that we pull back from it makes quite a bit of sense. After all, the longer-term indicator but as we have made a “higher high”, I think it tells us that the buyers are most certainly in control and therefore we should not be looking to fade this rally based upon the moving average. Quite frankly, this is just an excuse for buyers to take profits at this point. That and the fact that we have moved in about an 80° angle.
Federal Reserve
Never forget that the Federal Reserve is looking to cut interest rates, and that, of course, will greatly influence what happens with the US dollar. The New Zealand dollar is a little less liquid than some of the other major pairs, so we could get a bigger move in general. While the Federal Reserve was expected to cut interest rates later this year, the fact that the Americans and the Chinese haven’t necessarily finished off a deal should continue to keep the Federal Reserve looking to cut. Beyond that, if they do cut a deal it should be good for the New Zealand dollar as it is so highly sensitive to the Chinese economy. In a sense, the New Zealand dollar being at this extraordinarily low level could be a “win-win situation.”

NZDUSD Chart
Larger “W pattern?”
At this point, it looks as if we have just finished off a larger “W pattern” in the market. That, of course, is a very bullish sign so therefore it’s only a matter of time before buyers come back into the marketplace. It’s very likely that the 50 day EMA, pictured in red on the chart is going to offer support underneath. In fact, if you look at this chart it’s easy to see how it moves right along with some of the other major currency pairs, and therefore it’s just simply a function of the US dollar more than anything else at this point.
If we were to turn around and break down below the 50 day EMA, then I think the pattern is busted, and it’s very likely that we would continue to go down to the 0.65 handle. To the upside, based upon the measurement of the “W pattern”, we should be looking for a move towards the 0.69 handle. That is an area that has been important more than once in the past, so it should attract a lot of attention this time as well.

