The Elliott Waves theory is strongly dependent on the Fibonacci numbers. Without the Fibonacci numbers, counting waves with the Elliott principle is simply not possible. So far in our Forex Trading Academy project we’ve seen Fibonacci ratios being used everywhere: when establishing whether a pattern is a zigzag or a flat pattern; when calculating the extended wave of an impulsive move; and when looking for the retracement levels in small and large x-waves. Fibonacci numbers are everywhere in the Elliott Waves theory! However, the Fibonacci ratios have further uses, not only in showing the type of the pattern the market is forming. They can be used in finding the exact end of a pattern, or the target for a specific trade. One of these situations is the so-called Waterfall effect. Despite what the name suggests, it refers not only to bearish moves the market may form, but also to bullish ones.
Trading with the Waterfall Effect
Before going into even more detail regarding the waterfall effect, we should say that such an analysis can only be used with corrective waves. Moreover, out of all the corrective waves possible with the Elliott theory, this refers to triple combinations only. As a quick recap, a triple combination is formed out of three simple corrections connected by two small x-waves. It is exactly this situation that the Waterfall effect is referring to: the alternation of the three simple corrective waves. The basic idea is to interpret the possible length of the second and the third corrections based on the length of the first one. For this, Fibonacci ratios must be used. Trading with the Waterfall effect can be made both in the direction of the complex correction and also in trying to pick a top or a bottom the market may form. It requires a few steps to be taken in order for the whole process to be a logical one.
Using the Length of the First Correction
Traders will not know when a complex correction is going to form. All that traders do know at any one moment in time is that after an impulsive wave, a correction should follow. If the correction is a simple one, it must be confirmed by future price action. If such a confirmation does not show, then the correction must be a complex one. This means that at least one x-wave should follow, and this will give plenty of time for the overall Waterfall effect trading plan to be made. Such a plan should start from the moment the x-wave is completed and the market moves beyond the end of the first correction. At this very moment, we do not know whether the market is going to form a double or a triple correction; but the Waterfall effect is going to give us a clue as regards what to expect. To solve this riddle, the following things need to be done:
- Measure the length of the first correction with a Fibonacci retracement tool in order to measure 61.8% of it. We know by now that a complex correction cannot start with a triangle, so the only two possibilities that remain are for a flat or a zigzag to appear as the first correction. The Fibonacci tool should therefore be dragged from the start of the flat or zigzag until the end of it.
- The next thing to do is to take the 61.8% measured move and place it at the end of the first a-wave of the previous flat or zigzag that formed as the first part of the complex correction.
In doing that, traders can make an educated guess about where the end of the second correction should be. If the market indeed does go to that 61.8% measured move and reacts at that level, it means a triple combination will follow. On the other hand, if there is no reaction at that level, or maybe the level is not even reached, it means that the complex correction is most likely a double combination. In this way, we have already established the nature of the pattern that is about to form based on the first condition of the so-called Waterfall effect.
Using the Length of the Second Correction
If the market reacts to the 61.8% measured move as explained above, a trade in the opposite direction should be opened. The idea here is to trade the retracement of the x-wave, and we know that it is not possible for such a retracement to extend more than 61.8% of the second correction. A proper target should be 38.2% of the second correction, and the stop loss should be set based on a risk/reward ratio. Such a ratio should be at least 1:2 normally, but in our case even 1:1 should be enough as we’re trading just a small retracement. By the time the 38.2% retracement of the second correction comes, a trade in the direction of the overall triple combination should be opened. This is basically an opposite trade: If the previous trade was a long one, this one should be a short trade. The idea behind it is to trade the third correction in a triple combination. If you refer to the article dedicated to triple combinations, you’ll find that these patterns end almost always with a contracting triangle. Having said that, it means that we already know the type of the third correction: a contracting triangle. What would be an appropriate target for the newly opened trade?
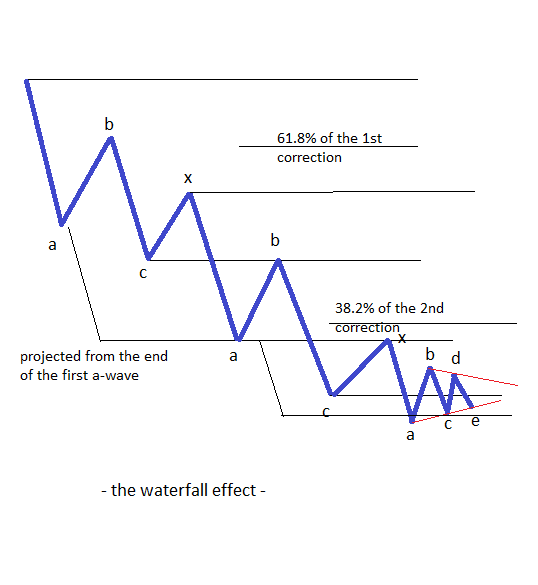
The thing to do is to use the Fibonacci retracement tool again, and this time to measure the length of the second correction in the triple combination pattern. The idea is to take 38.2% out of it and apply it at the end of the a-wave of this second correction. The resulting level represents the area where the a-wave of the contracting triangle, the last segment of the triple combination, is supposed to end. That area should be the target for the opened trade already in place, and the area where a new trade, this time in the opposite direction, should be opened.
What would the target be for this last trade? First of all, consider that this trade will take some time, as there are still four other segments of the triangle to follow. Secondly, a triple combination is rarely completely retraced, so choosing the exit for this trade should not consider full retracement. A typical take profit should be set anywhere between 50% and 61.8% retracement from the start until the end of the triple combination. In this way, we have traded the whole pattern using this wonderful Waterfall effect.
The name of this strategy comes from the fact that, by respecting these Fibonacci ratios, the market moves in locked steps. Keep in mind that, as mentioned earlier, such a trading tactic can be used not only on bearish trends, but on bullish ones as well.
Other educational materials
- Types of Contracting Triangles
- Special Types of Triangles
- Types of Expanding Triangles
- Trading with X Waves
- The Concept of a Running Correction
- Double Three Running Patterns
Recommended further readings
- “Stock market crashes, precursors and replicas.” Sornette, Didier, Anders Johansen, and Jean-Philippe Bouchaud. Journal de Physique I 6, no. 1 (1996): 167-175.
- Trading Systems: Secrets of the Masters. Krutsinger, Joe. McGraw-Hill, Inc., 1997.


